I’m going to stray a bit from my usual topics of the physical and biological sciences into the field of Economics for this post. I hope you’ll allow me to do so because I think that the issue of Wealth Inequality, and its effects on us as a society may very well be the most critical, as well as divisive issue in the world today.
We all have a basic idea of just what Wealth Inequality is. The rich own big mansions and their savings and investments are so profitable that many do not need to work, in other words they can literally live off of the labour of others. At the other end of the wealth spectrum the poor usually do not own their homes, instead they rent with the money often going to the rich. Most of us live in the middle somewhere, we may own our home but if so then that’s the most valuable thing we own.
Getting any kind of accurate picture about Wealth Inequality however requires an agreed upon methodology before you even begin to gather your data and analyze it. That’s just a fancy way of asking; how do they measure Wealth Inequality.
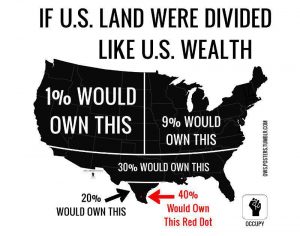
Of course a part of it is simply getting the raw data and here in the United States much of which is obtained by census reports and income tax filings. The general picture of wealth distribution developed from this data is startling; the top 1% of households are found to own 35% of the nations wealth while the bottom 40% own less than 1%. Putting it another way the average rich person owns about 1500 times as much as the average poor person. The image below graphically shows how, if the US land mass were allotted as its wealth is.

While this mass of data clearly shows the distribution of wealth in the USA, or any country, in order to make comparisons between countries, or of the same country over time, economists like to use a calculated index value known as the Gini coefficient or Gini index. The Gini coefficient was first developed by an Italian statistician named Corrado Gini in his 1912 paper Variabilità e mutabilità (Variability and Mutability). I’ll try to describe the Gini coefficient using the graph below.

In the graph an ideally equal society would be one in which 1% of the people own 1% of the wealth, 2% own 2% of the wealth and so on. 40% of the people own 40% of the wealth, 65% own 65% right up to 100% of society owning everything, 100%. In other words X=Y and you get a straight line at a 45º angle. This ideal situation corresponds to a Gini coefficient of zero (0).
On the other hand in the situation where only a very few, or even a single individual owns everything you get a flat line along the bottom going from left to right ending in a straight vertical line on the right hand side. In other words the lowest 99% own nothing and wealth is concentrated in just a few hands. The Gini coefficient for such a society is defined as a one (1).
Both of these situations are unrealistic; every real society has a Gini coefficient somewhere between 0 and 1 with the lower the coefficient the more fairly, more equitably wealth is spread throughout the population. The current calculated Gini coefficient for the United States is calculated to be 0.45, which is one of the highest, that is most inequitable, among the developed world. And it has been steadily increasing since the 1980s with an extra spurt following the financial crisis of 2008. To give you an idea of where the US sits compared to other nations the list below gives the Gini coefficients for 12 representative countries including the USA. By the way the Gini coefficients for the other countries comes from data collected by the Central Intelligence Agency (the CIA) because America’s spies realize that inequality in a country will lead to civil unrest even if the rest of our government denies it.
Nigeria 0.488
China 0.465
USA 0.45
Russia 0.421
Japan 0.379
Viet Nam 0.376
India 0.352
United Kingdom 0.324
Ireland 0.313
Australia 0.303
France 0.292
Germany 0.27
Notice how only Nigeria and China are more unequal than the US, not terribly good company to be in with. If you’d like to see the CIA’s entire list click on the link below.
https://www.cia.gov/library/publications/the-world-factbook/fields/2172.html
So, Wealth Inequality is a real problem in this country and it’s growing. The current Tax Bill backed by the Republican congress and President Trump will only accelerate the flow of wealth to the top while increasing the taxes of the middle and lower class. This state of affairs, where the rich contribute huge amounts of money to political campaigns in exchange for legislation favouring them is destructive to democracy in any sense of the word.
What can we do? First and foremost we must fight for a tax policy that shifts the tax burden onto those who can better bear that burden, the rich. President Obama championed what he called the “Buffet Rule”, named for the billionaire Warren Buffet who maintained that he should pay at least as much in taxes as his secretary. The Buffet Rule was designed to make certain that the very rich could not use loopholes in order to pay little or no taxes. Some such progressive policy has become imperative if we are to continue as a land “Where all Men are created Equal.”
Finally real campaign finance reform must be introduced in order to reduce the influence that those who have the wealth have over out elected officials. Until these reforms are put into effect the attacks on our democratic institutions can only worsen, eliminating all hope of “Making America Great Again.”
