The Economy and the 2024 Election: You’ve heard a lot of Claims by both Parties. What do the figures actually say and what do they actually mean! 

Once again the US is in a critical election year and once again it’s the economy that is the number one issue that voters care about. That means that once again both parties are filling the TV airwaves with ads claiming that they are the ones who can best handle the economy. I know that you’ve seen the Republican ads claiming that under Biden inflation was the worst in 40 years, it was but only for one month.

Economists actually like a bit of inflation because that spurs us to go out and spend our money before it decreases in value. The Federal Reserve’s target value is 2%. (Credit: Stanford Report Stanford University)

The Democrats meanwhile claim that unemployment under Biden has been at its lowest level in 60 years, it was but over the last few months it’s been creeping up. Meanwhile, under the Democrats wages have been steadily rising, but have they been rising enough to offset inflation? It’s all so confusing and with both sides only talking about the statistics that makes them look good it’s hard to know what to think.

In a sense unemployment hurts a small fraction of our population a lot while inflation hurts everyone a little. Finding a reasonable medium is one of the big questions facing economists. (Credit: Live Science)

Well I’m going to try to give it a shot. I have to tell you this is the most difficult post I’ve ever attempted. Economists not only have a large number of different quantities, Inflation, Unemployment, GDP and the like that they keep track of but they have several different ways of reporting those measurements. For example the Consumer Price Index, considered the best gage of inflation, is reported every month but announced as being ‘on an Annual Basis’. How can something that’s measured every month be on an annual basis? And most of the other quantities that economists talk about, like GDP and wages, but not unemployment, have to be adjusted for inflation. It’s no wonder that few people can make heads or tails about the claims being made by the Republicans and Democrats. However at least I will try to bring all the stats together, not just the ones that favour one side, and hopefully I’ll be able to explain it all enough for you to make the decision that’s right to you!

Harris or Trump, that’s the choice we have to make in November. Let’s all try to make an informed one! (Credit: Spotlight Pa)

I have to start with inflation because, as I just said several other quantities have to be adjusted for inflation in order to make a fair comparison between what happened during the Trump administration from 2017-2020 and the Biden administration from 2021-2024. We all have a basic idea of what inflation is, prices keep going up, as time passes the cost of just about everything from food to gas to cars and even homes keeps rising year after year. That means that a dollar in 2024 buys a little bit less than a dollar would back in 2023 and a lot less than a dollar would have back in say the year 2000.
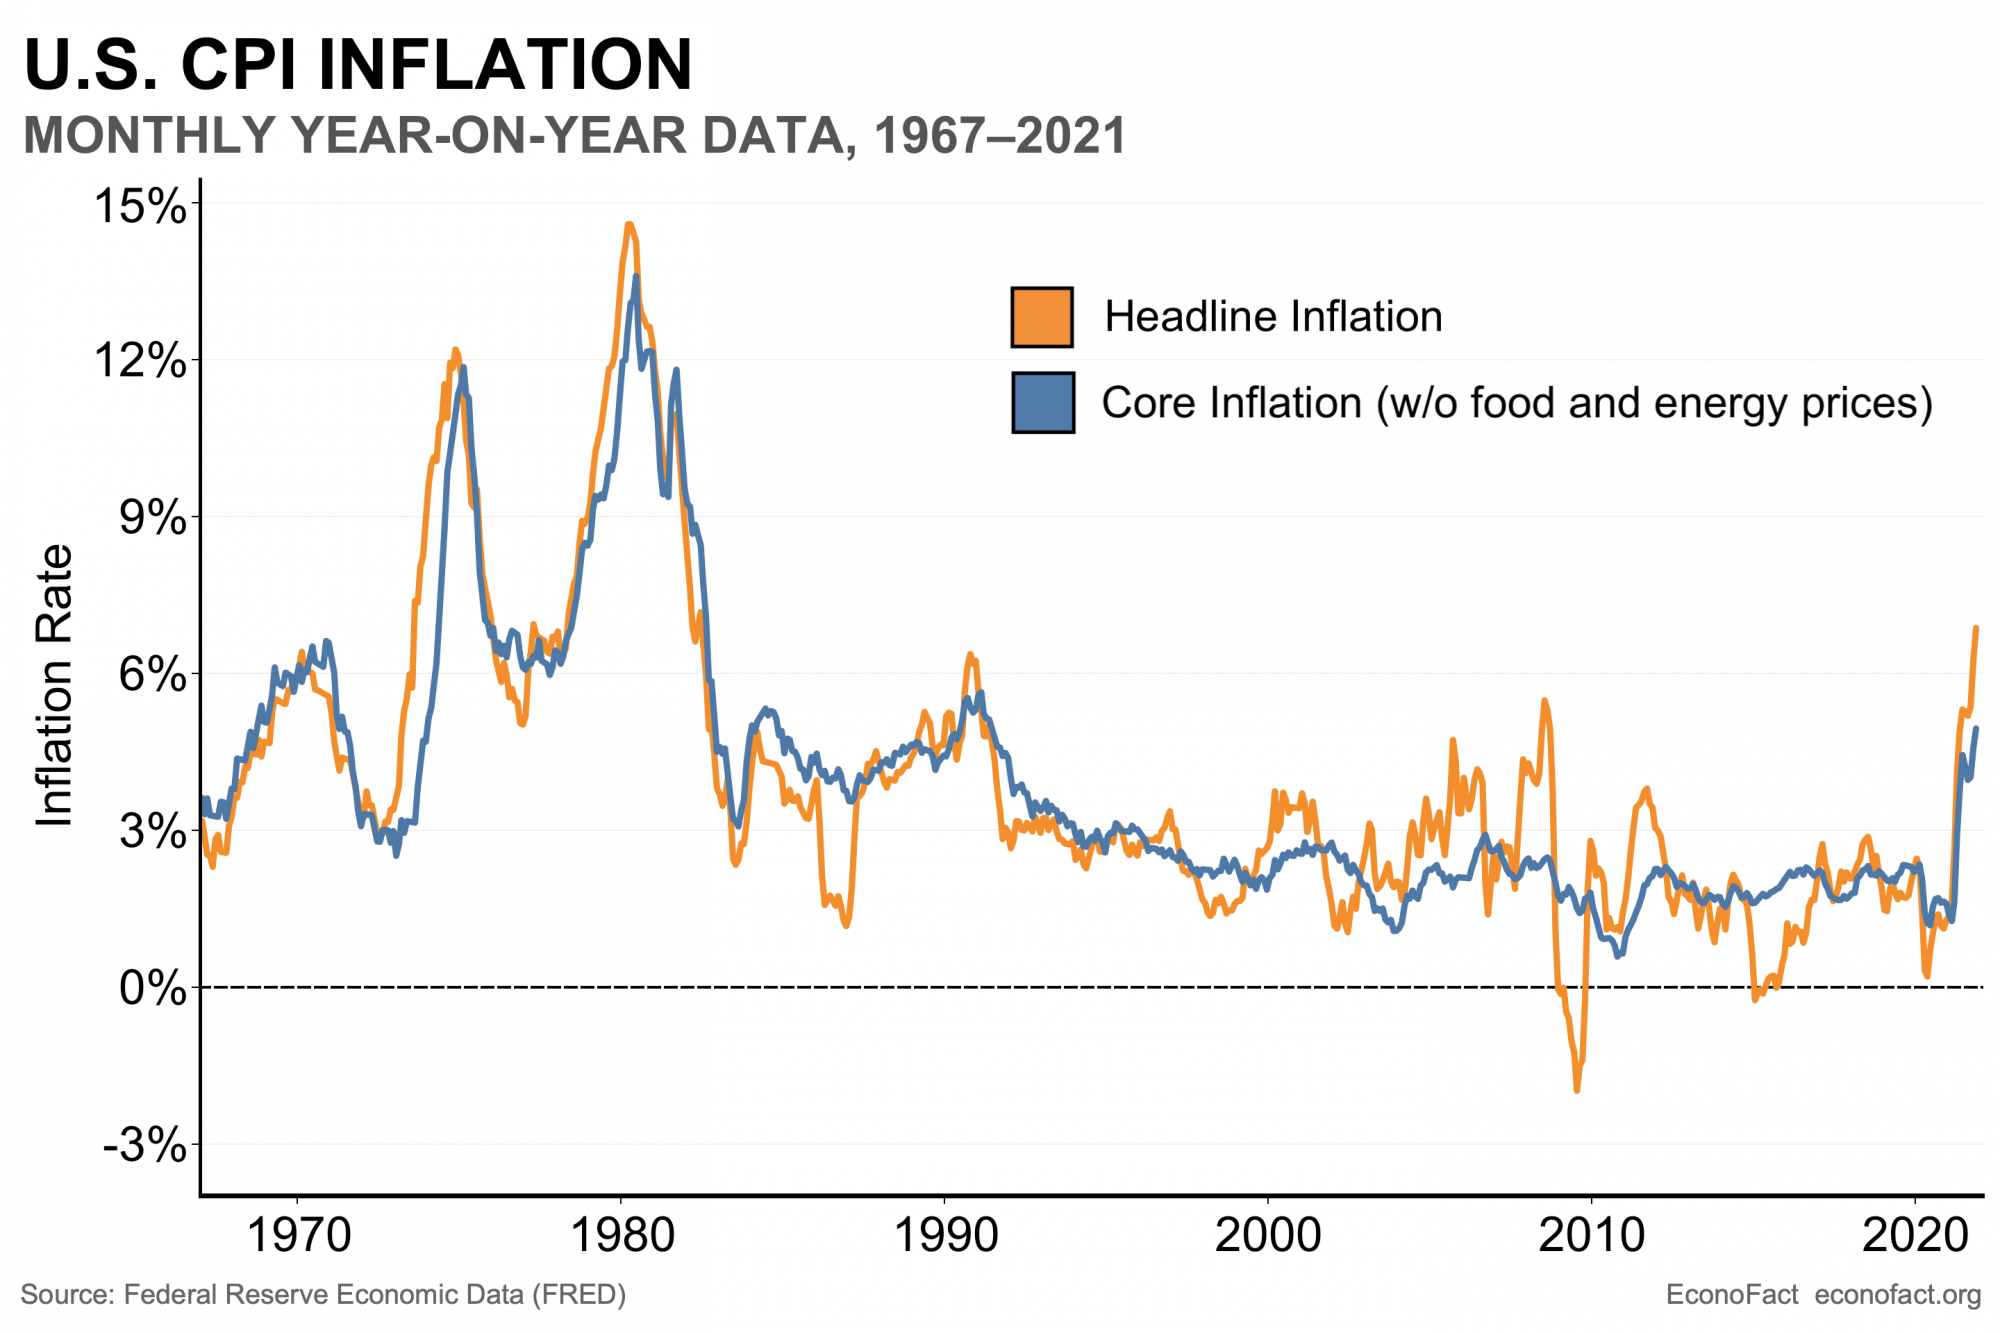
Back in the 1970s and early 80s inflation was much higher than anything we’ve seen in decades. That’s a big reason why the American people switched our economy to a Supply Side, Market Based one. (Credit: EconoFact)

As I said inflation also affects several other economic measures as well, such as wages. Let’s say that last year your boss gave you a raise of 4%, sounds pretty good. Unfortunately inflation over the last year came in at 4.1% so you actually lost 0.1% of your pay. In economic terms your wage increase did not keep pace with inflation. On the other hand if you received a raise of 4% and inflation stayed below the Federal Reserve’s target of 2%, then you did indeed get an actual 2% increase in your income, your raise minus inflation.

Two years ago, inflation was at the highest rate since the 1980s, notice the steep climb of the red line between Jan21 and Jan22. However, wages were also high so they kind of canceled each other out! (Credit: Statista)

Inflation also affects our whole nation’s growth in the same way. We’ve all heard of the Gross Domestic Product (GDP) which is the sum total of all goods and services bought and paid for in a year, everything and every time money changes hands it contributes to the GDP. The growth of our country’s economy is measured in the percentage growth of GDP and if GDP actually goes down we are basically in a recession. But even an increase in GDP has to be higher than the rate of inflation or else, as with wages above, the country’s income actually got smaller. On the other hand two quantities that are not effected by inflation are unemployment and job growth. The percentage of people who are unemployed is the same no matter what happens to the value of the dollar. The same is true for the number of jobs created, or lost.

Throughout this post I have taken the various economic quantities effected by inflation and adjusted their values so that everything is given in terms of 2024 dollars. So now let’s take a look at how inflation has increased during the four years of the Trump administration and the first three and a half years of the Biden administration, remember Biden’s term is not yet over. Chart 1 shows how inflation increased for each president.
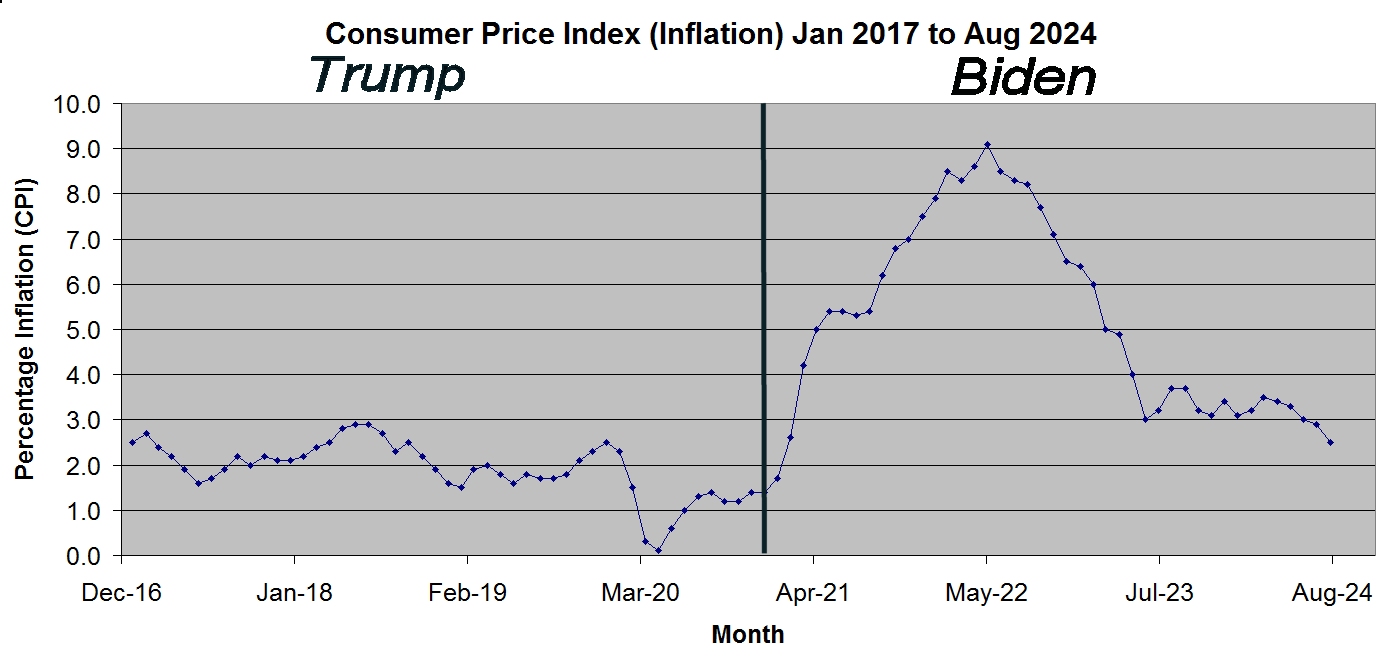
Inflation during Biden’s first two years in office was much higher than at any point in Trump’s term. We were just coming out of a pandemic however and the economy of the whole world was recovering from Covid. (Credit: R. A. Lawler)

On the surface it looks as if inflation has been much higher during Biden’s term as President. Indeed the Republicans have been using this fact as their main attack against Democrats in general claiming that inflation under Biden reached its highest level in 40 years. It is worth noting however that the one bad year that Biden had with inflation also was the year that the US and the rest of the world came out of the Covid-19 pandemic.
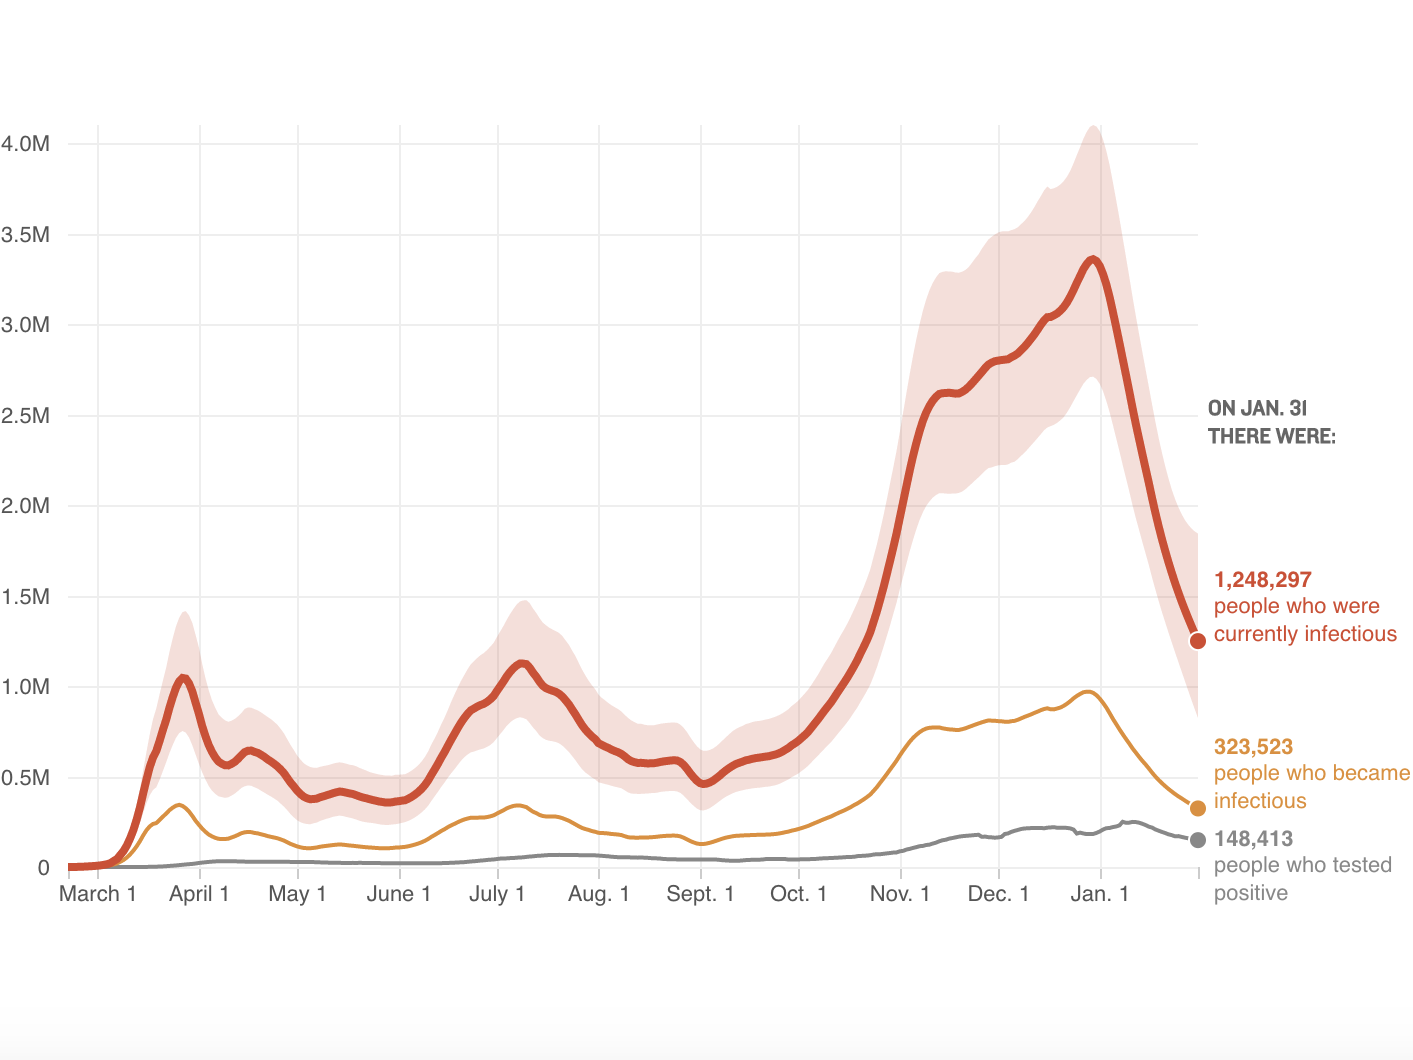
Between March of 2020 and February of 2021 millions of American got sick from Covid, and over 100,000 died from the disease. How could that not affect our economy? (Credit: NPR)

You will remember that during the pandemic a considerable portion of the economy shut down and once the threat of Covid had lessened there were a number of issues getting people back to work, fixing supply chain problems and etc. For example, during Covid people cut back a lot on travel, even such ordinary trips as going to a restaurant for dinner. Further evidence that it was Covid that triggered the inflation comes from the fact that the rest of the world saw as high or higher inflation. The European Union, the UK, China and Japan all suffered from a spike in inflation.
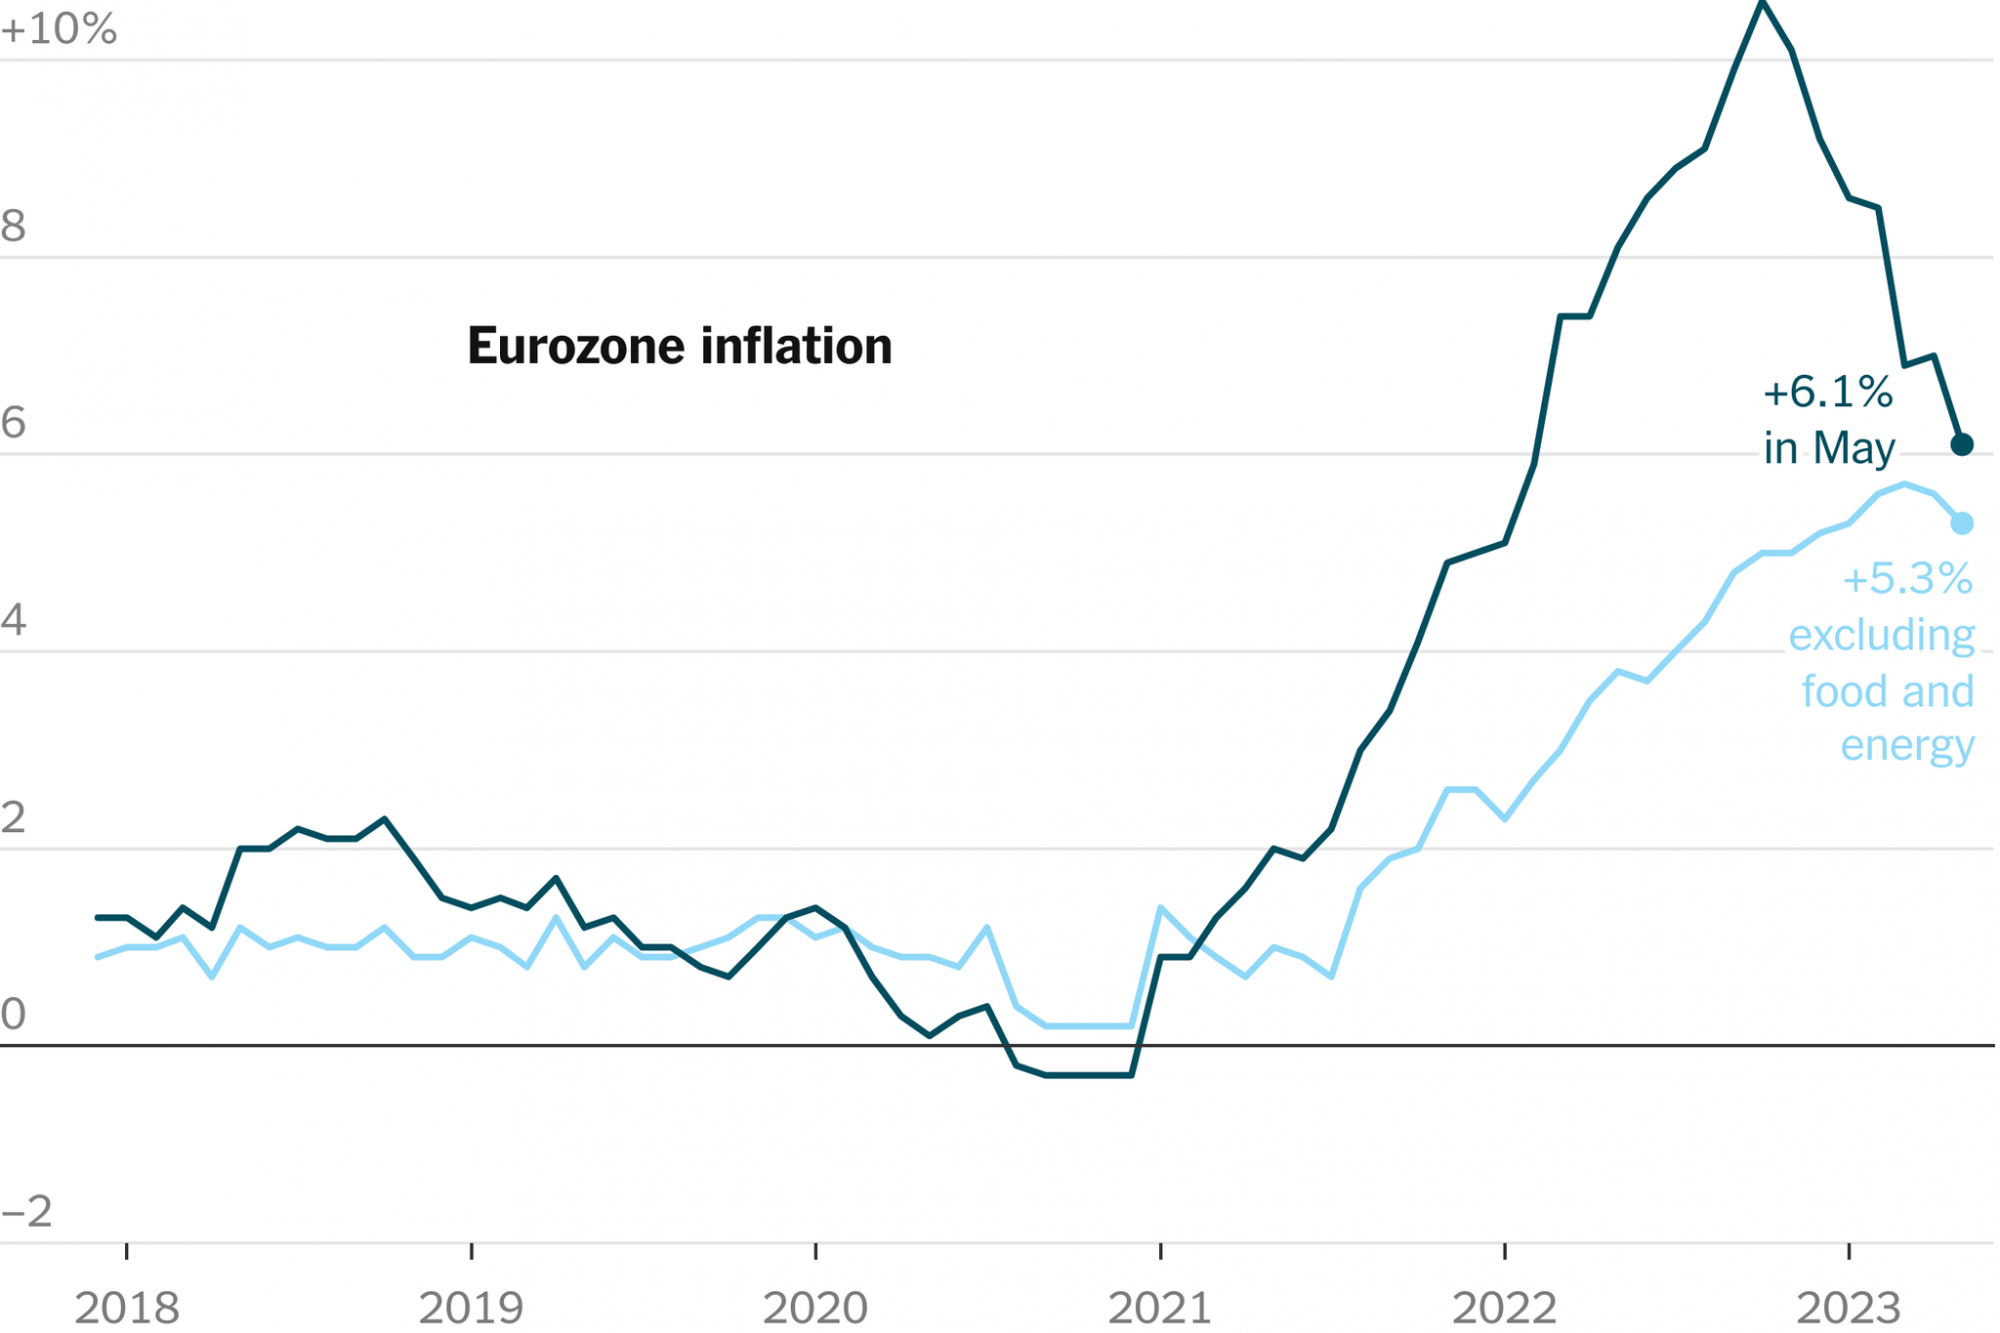
Over the last three years inflation in the European Union was even higher than here in the US. Ya can’t blame the democrats for that. (Credit: The New York Times)

Because of this oil companies cut back on their production of gasoline and then, when the pandemic ended people immediately wanted gas again. Unfortunately it took the oil companies some time to bring production back to pre-covid levels. That time lag led to a big increase in gas prices that contributed to inflation. That supply issue was eventually solved however and for the past two years gas prices have dropped slowly but surely helping to stabilize inflation.

Notice the big dip in oil production that occurred in March of 2020, just as the pandemic began. It took more than a year to recover from the pandemic’s drop and that delay added to inflation. (Credit: CNBC)

So now that we’ve considered the Democrat’s biggest economic liability going into this election let’s a look the Republicans’ biggest liability. That’s unemployment and if you’re going to blame Biden for the worst inflation in 40 years then you have to blame Trump for the worst unemployment since the Great Depression of the 1930’s, 80 years ago.
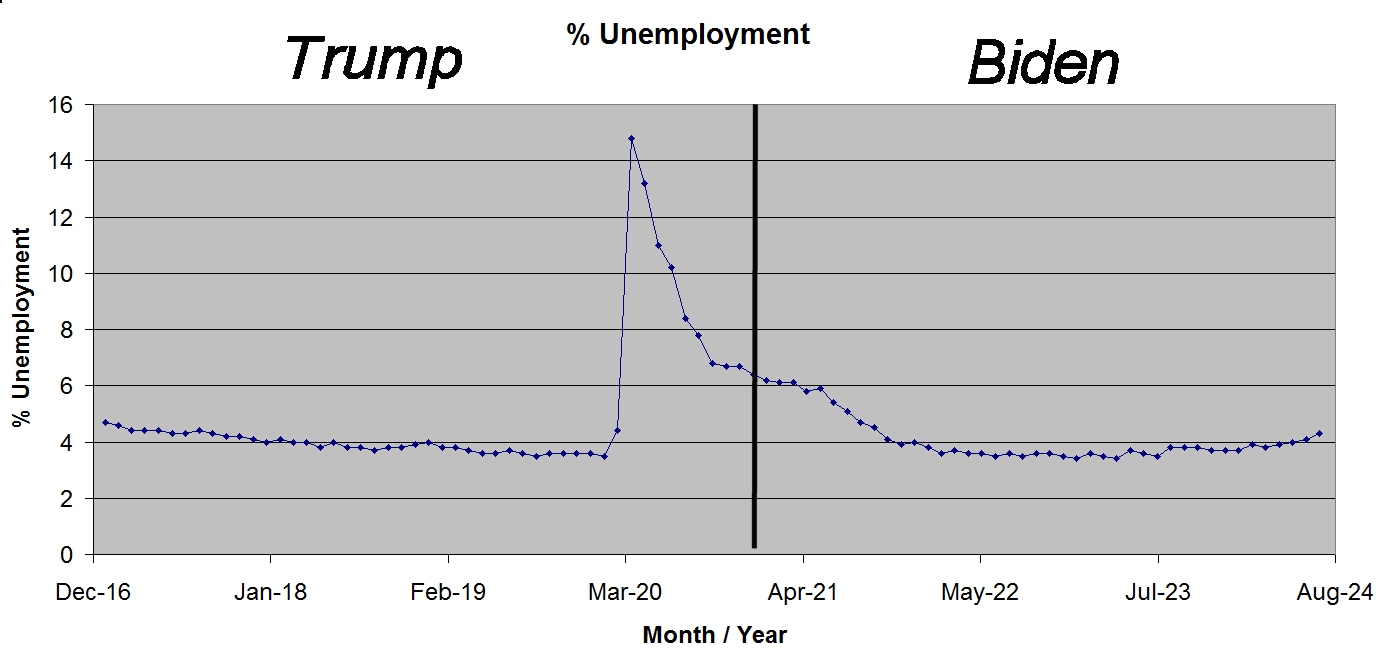
The huge spike in unemployment caused by Covid is obvious, the highest level of unemployment since the 1930s!!! Still, Trump was no more to blame for unemployment than Biden was for inflation. That’s just what happens to economies when a pandemic hits! (Credit: R. A. Lawler)

Actually unemployment for Trump’s first three years in office was quite good. The unemployment level his first year was a bit over 4% but dropped below 4% for Trump’s second and third year. Then in 2020, Trump’s fourth and final year in office unemployment skyrocketed to nearly 15%, literally the worst unemployment figure since the Great Depression back in the 1930s. So what happened to cause such a tremendous number of people to lose their jobs, well of course it was Covid.

We all remember seeing signs like this during Covid. So unemployment spiked during the pandemic just as inflation spiked immediately after it. (Credit: Liberty Street Economics)

With the pandemic spreading, with deaths and hospitalizations increasing the hospitality industry, restaurants, hotels, movie theaters etc, virtually closed because people could not gather together for fear of getting infected. Baseball games were played without fans in the seats so there were no concession stands that needed any workers; symphony orchestras stopped performing so there was no need for musicians. The fact that unemployment didn’t go higher than 15% during Covid was remarkable and shows the strength of the American economy. Once Covid became less of a threat unemployment quickly dropped. Indeed for almost two years during Biden’s term of office unemployment dropped to its lowest level since the 1960s. A statistic the Democrats are happy to remind us all about.

Here’s the statistic Biden wants everyone to know about, more jobs created per month than any President ever! But once again that’s also due to people getting their old jobs back once the pandemic eased. (Credit: X)

So, if you’re going to blame Biden and the Democrats for the worst inflation in 40 years then you have to blame Trump for the worst unemployment in 80 years. The plain fact is that no one is to blame, that both unemployment and the inflation that followed were caused by Covid. The lesson to be learned here is that there are factors outside the control of anyone, even the President that shape our economy.
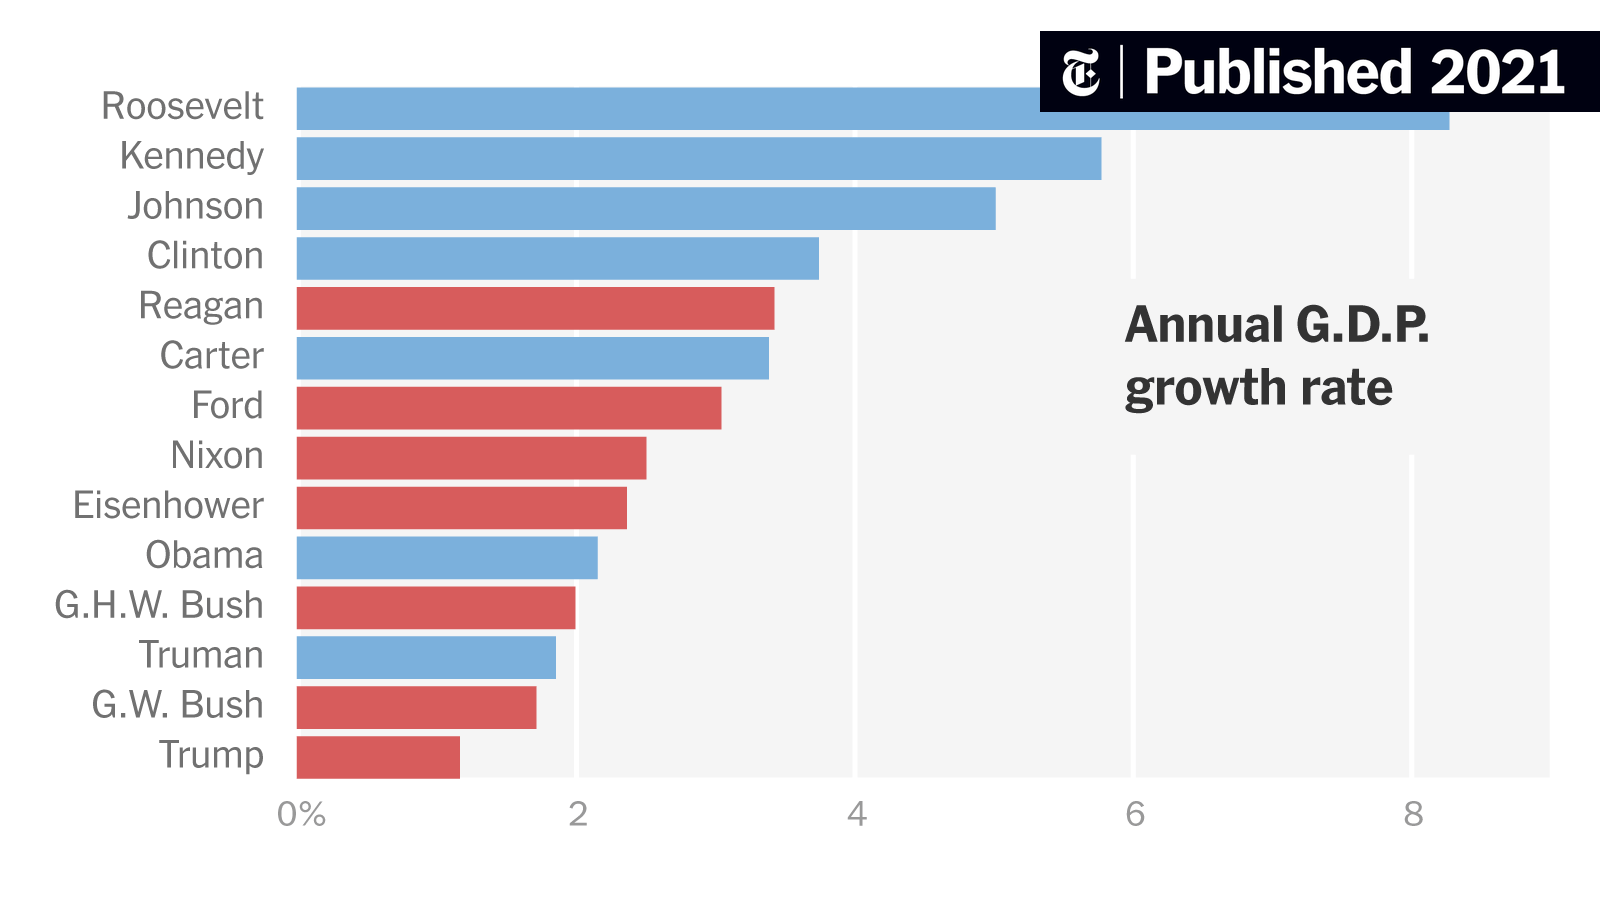
If President’s do have power over the economy then Democrats seem to be better at it than Republicans! (Credit: The New York Times)

In my next post I’ll continue to discuss some other economic factors such as wages, GDP and the Deficit and how both Trump and Biden handled them.
Geology News for September 2024: 

Geology is usually a quiet science, we generally only hear about it when there’s been a big earthquake or volcano eruption and even then all that the news media talks about is the destruction that’s happened to both people and property. There’s very little discussion of what an earthquake or volcano is and how they relate to our planet as a whole. Today I’d like to discuss two stories about our Earth that aren’t directly tied to either quakes or volcanoes and which don’t threaten destruction but which do tell us a great deal about the planet we live on.

Collecting and studying rocks is a large part of the science of Geology and is something that even a child can do as a way to get started in a career in science. (Credit: ThoughtCo)

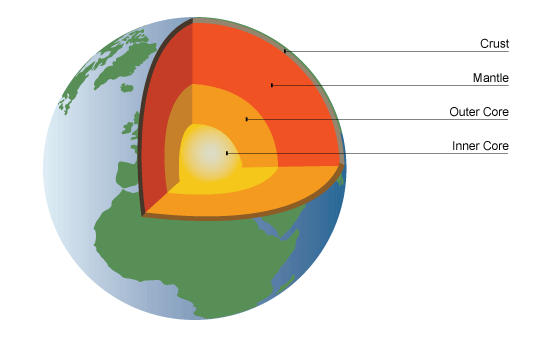
We all remember from our High School science classes how our planet is built. We learned that at Earth’s very center there is a solid metal inner core composed mostly of iron about the size of the planet Mars. Above this solid core is a liquid outer core of molten metal, again mostly iron, this liquid outer core being about a thousand kilometers thick. On top of the outer core rides the 2,900 kilometer thick Mantel which is composed of a mixture of metals and silicates and which is often described as being plastic because it’s too warm to be solid but not hot enough to be completely liquid. Finally at the top is the 10-20 kilometer thick crust of solid rock that all life exists upon. That’s the basic model we all learned in school.

Just like we remember from High School our earth is like a Russian doll with layers of material one upon the other. (Credit: Handy Geography)

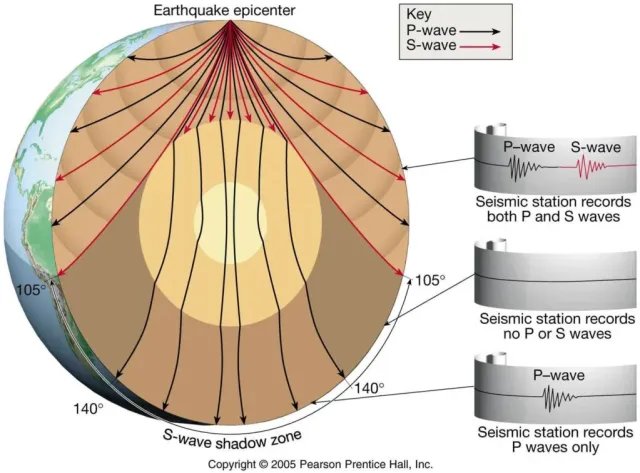
The way that scientists know that’s what the inside of Earth is like is by studying the different kinds of waves that are generated by large earthquakes or volcanic eruptions and which propagate around the entire planet. For example what geologists call a secondary or s wave is what physicists like me call a transverse wave, the kind of wave you can make with a piece of rope. Now transverse waves, s waves cannot go through either a liquid or a gas, they need a solid media to transmit them. So, if a large earthquake occurs in let’s say the island of Java in Indonesia then geologists at the exact opposite spot on Earth in Ecuador would not observe any s waves from that event because the s waves cannot pass through the liquid inner core.
Earthquakes generate both ‘S’ and ‘P’ waves which propagate around the world but only the ‘P’ waves can go through the Earth’s liquid core! (Geology Science)

On the other hand earthquakes also generate primary or p waves that are like sound waves and which can go through a liquid so the scientists in Ecuador will see p waves from the quake on Java. It’s by studying the various ways that the waves generated by Earthquakes propagate that geologists have learned so much about the interior of our planet.

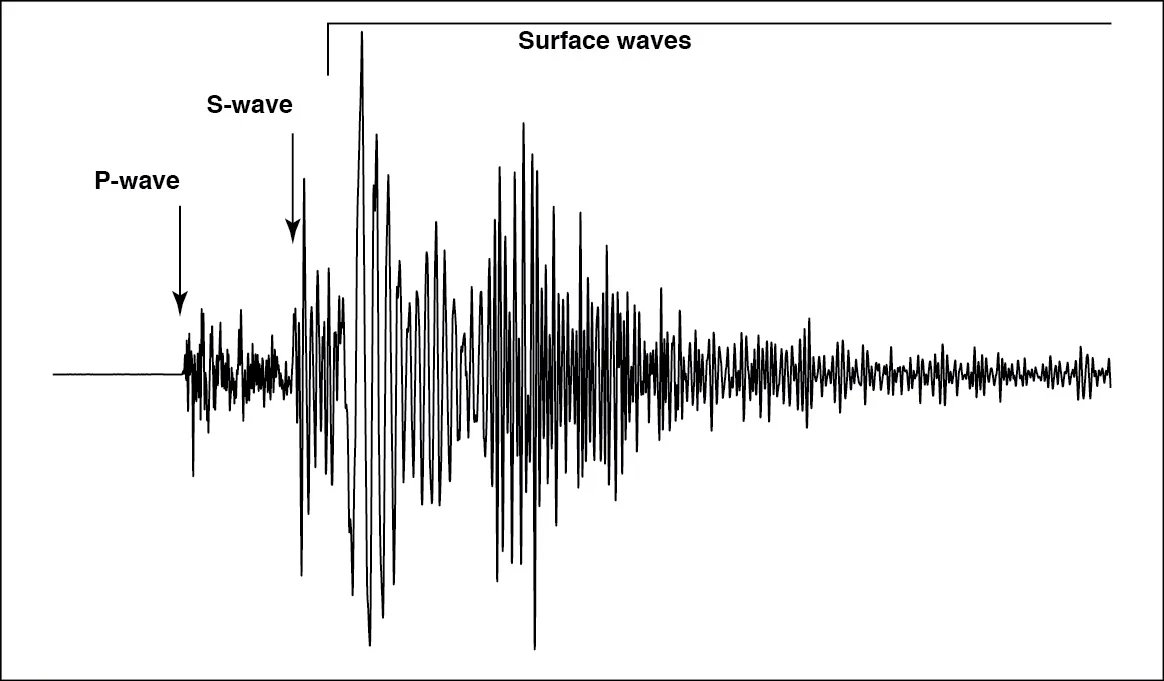
A typical seismic wave as recorded by a seismograph. The ‘S’ and ‘P’ waves are notes along with surface waves. (Credit: Michigan Technological University)

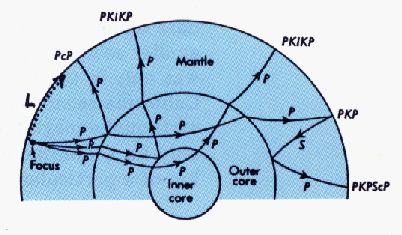
Now a new study is linking a mysterious kind of seismic wave called a PKP precursors with another mystery, volcanic ‘hot spots’ which are volcanoes that seem to last for hundreds of millions of years at the same spot on Earth even as the continental plates move across the top of them. The Hawaiian Island chain is the best know example of this, a fixed volcano ‘hot spot’ that has created a series of islands as the Pacific plate moved across it. The supervolcano beneath Yellowstone Park is another such long lasting ‘Hot Spot’.
‘PKP’ waves are generated when ‘P’ waves are reflected off of the boundaries between the Earth’s layers. As you can see in the image PKP waves can be pretty complicated. (Credit: USGS.gov)

Geologists studying the PKP precursor waves at the University of Utah recognized that they were not being directly generated by earthquakes, instead PKP waves appeared to be echoes, that is waves that were bouncing off of something deep underground and are then scattered in many different direction. Now the Utah geologists have succeeded in zeroing in on the locations where PKP waves originate and have discovered that they are clustered around the volcanic hot spots in the Pacific, North America and Iceland.

The Earth’s known volcanic ‘Hot Spots’. These areas of intense volcanic activity do not seem to move with the Earth’s tectonic plates but rather pierce through those plates. (Credit: www.geo.cornell.edu)

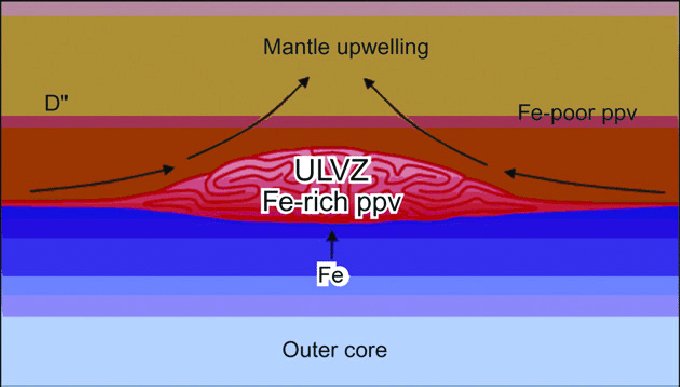
Based upon what the researchers can learn about these deep regions in the Earth’s mantel they have been christened ‘Ultra Low Velocity Zones’ (ULVZs) and appear to lay at the boundary between Earth’s mantel and liquid core. Exactly what connection these ULVZs have with the volcanic hot spots is unknown at present, do they cause the hot spots or do the hot spots attract the ULVZs? You can be certain however that geologists will concentrate their efforts to further understand the origins of PKP waves at the ULVZs.

Ultra Low Velocity Zones or ULVZs lay the boundary between the outer core and the mantel. They appear to have some relation to the Volcanic Hot Spots but exactly what is presently unclear. (Credit: Research Gate)

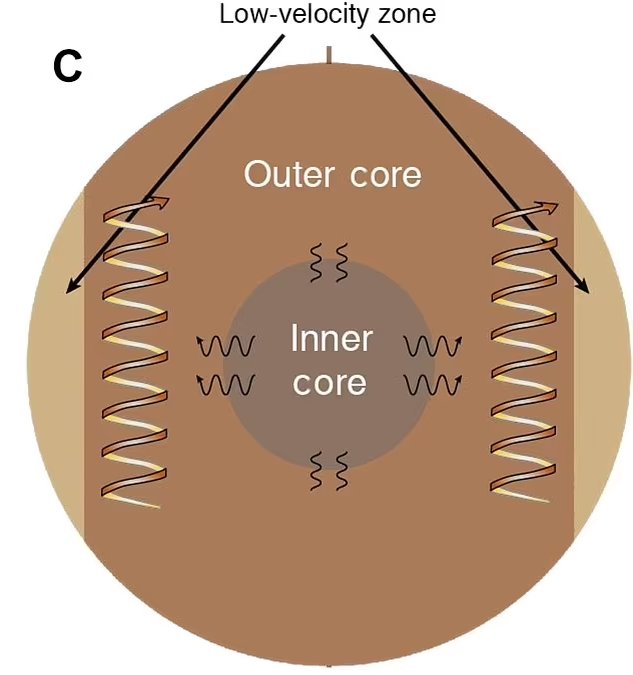
As I was writing about the paper describing the discovery of the Ultra Low Velocity Zones (ULVZs) by the geologists at the University of Utah a second paper was being prepared by a second group of geologists at the Australian National University that provides further details about the ULVZs. According to the Australians the ULVZs form a doughnut shaped structure roughly beneath the equator at the boundary between the inner core and the mantel. Now the precise details about the ULVZs differ slightly between the two papers but it’s exciting to watch as a new part of our planet is being discovered and explored.

Do the ULVZs form a doughnut shaped structure around our planet’s equator? That’s what the team in Australia assert. We’ll find out in time! (Credit: Daily Mail)

Even while they study our planet’s interior geologists also continue to learn more and more about Earth’s past. Throughout it’s history Earth has seen periods of large temperature swings that resulted in geological periods where the planet became so hot that it completely lost its polar ice caps as well as periods where the planet was so cold that they have been christened ‘ice ages’.

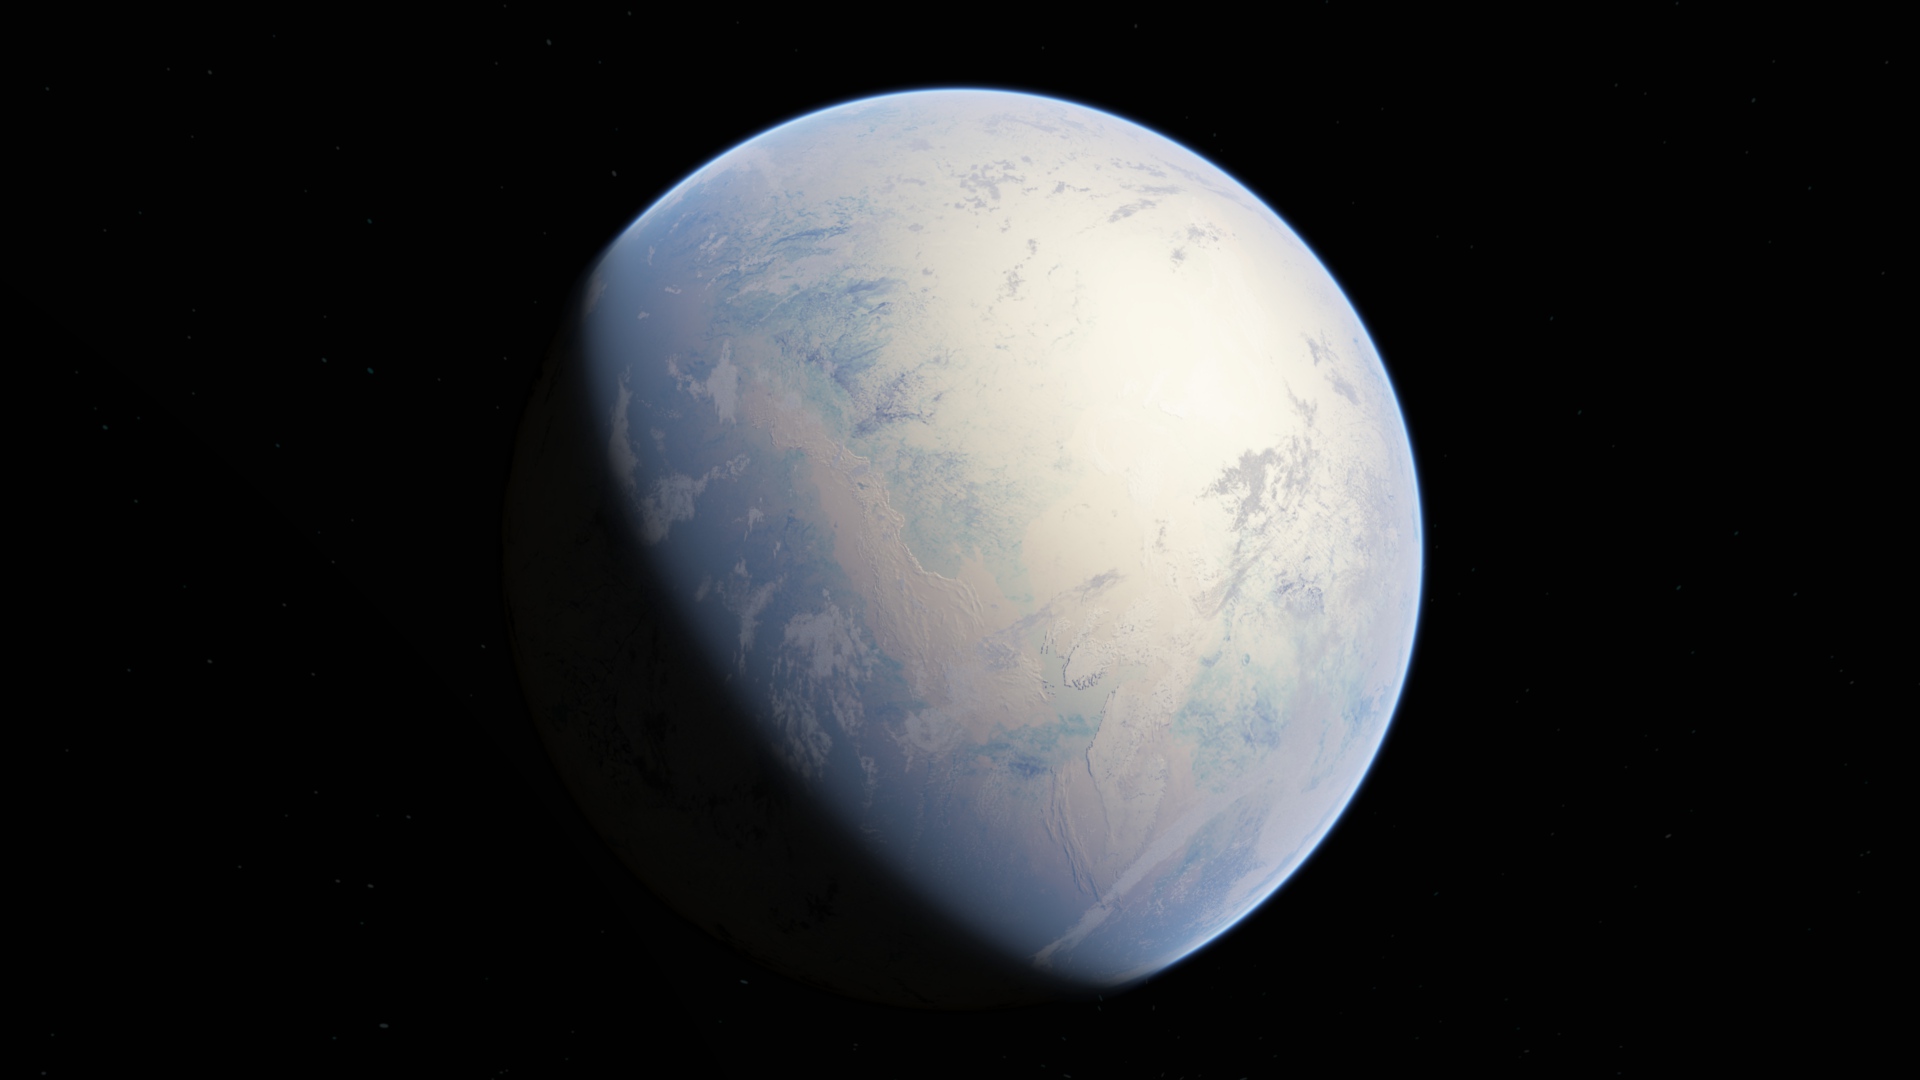
Our planet has had many ice ages over the past 4 billion years but one that occurred about 700 million years ago covered nearly the Earth’s entire surface. Geologists call that period ‘Snowball Earth’. (Credit: wikipedia)

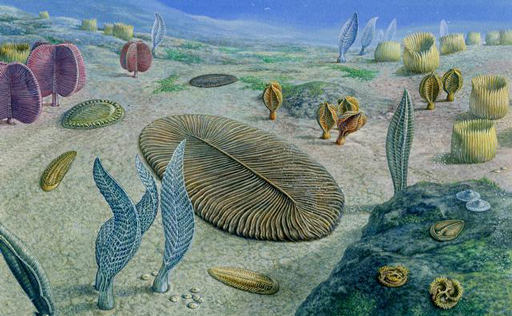
One of the most extreme cold periods occurred between 720 and 660 million years ago and is known as ‘Snowball Earth’ because virtually the entire planet’s surface was covered in ice. This particular ice age is of considerable importance not only because it was so extreme but because the first evidence for multi-cellular life occurs in the fossil record immediately after Snowball Earth. In fact evolutionary biologists have developed the theory that multi-cellular life evolved in order to survive the extremely harsh conditions of Snowball Earth and then exploded around the world as the glaciers retreated.

It was shortly after Snowball Earth that the very first multi-cellular creatures appear in the fossil record. Nobody thinks that’s just a coincidence. (Credit: Everything Dinosaur Blog)

The problem for both geologists and biologists is that ice ages have a tendency to destroy the geologic evidence of their own existence by the grinding and scouring of glaciers across the planet’s surface. For over a hundred years geologists have been searching for an unbroken stretch of sedimentary rock that records the entire history of Snowball Earth.

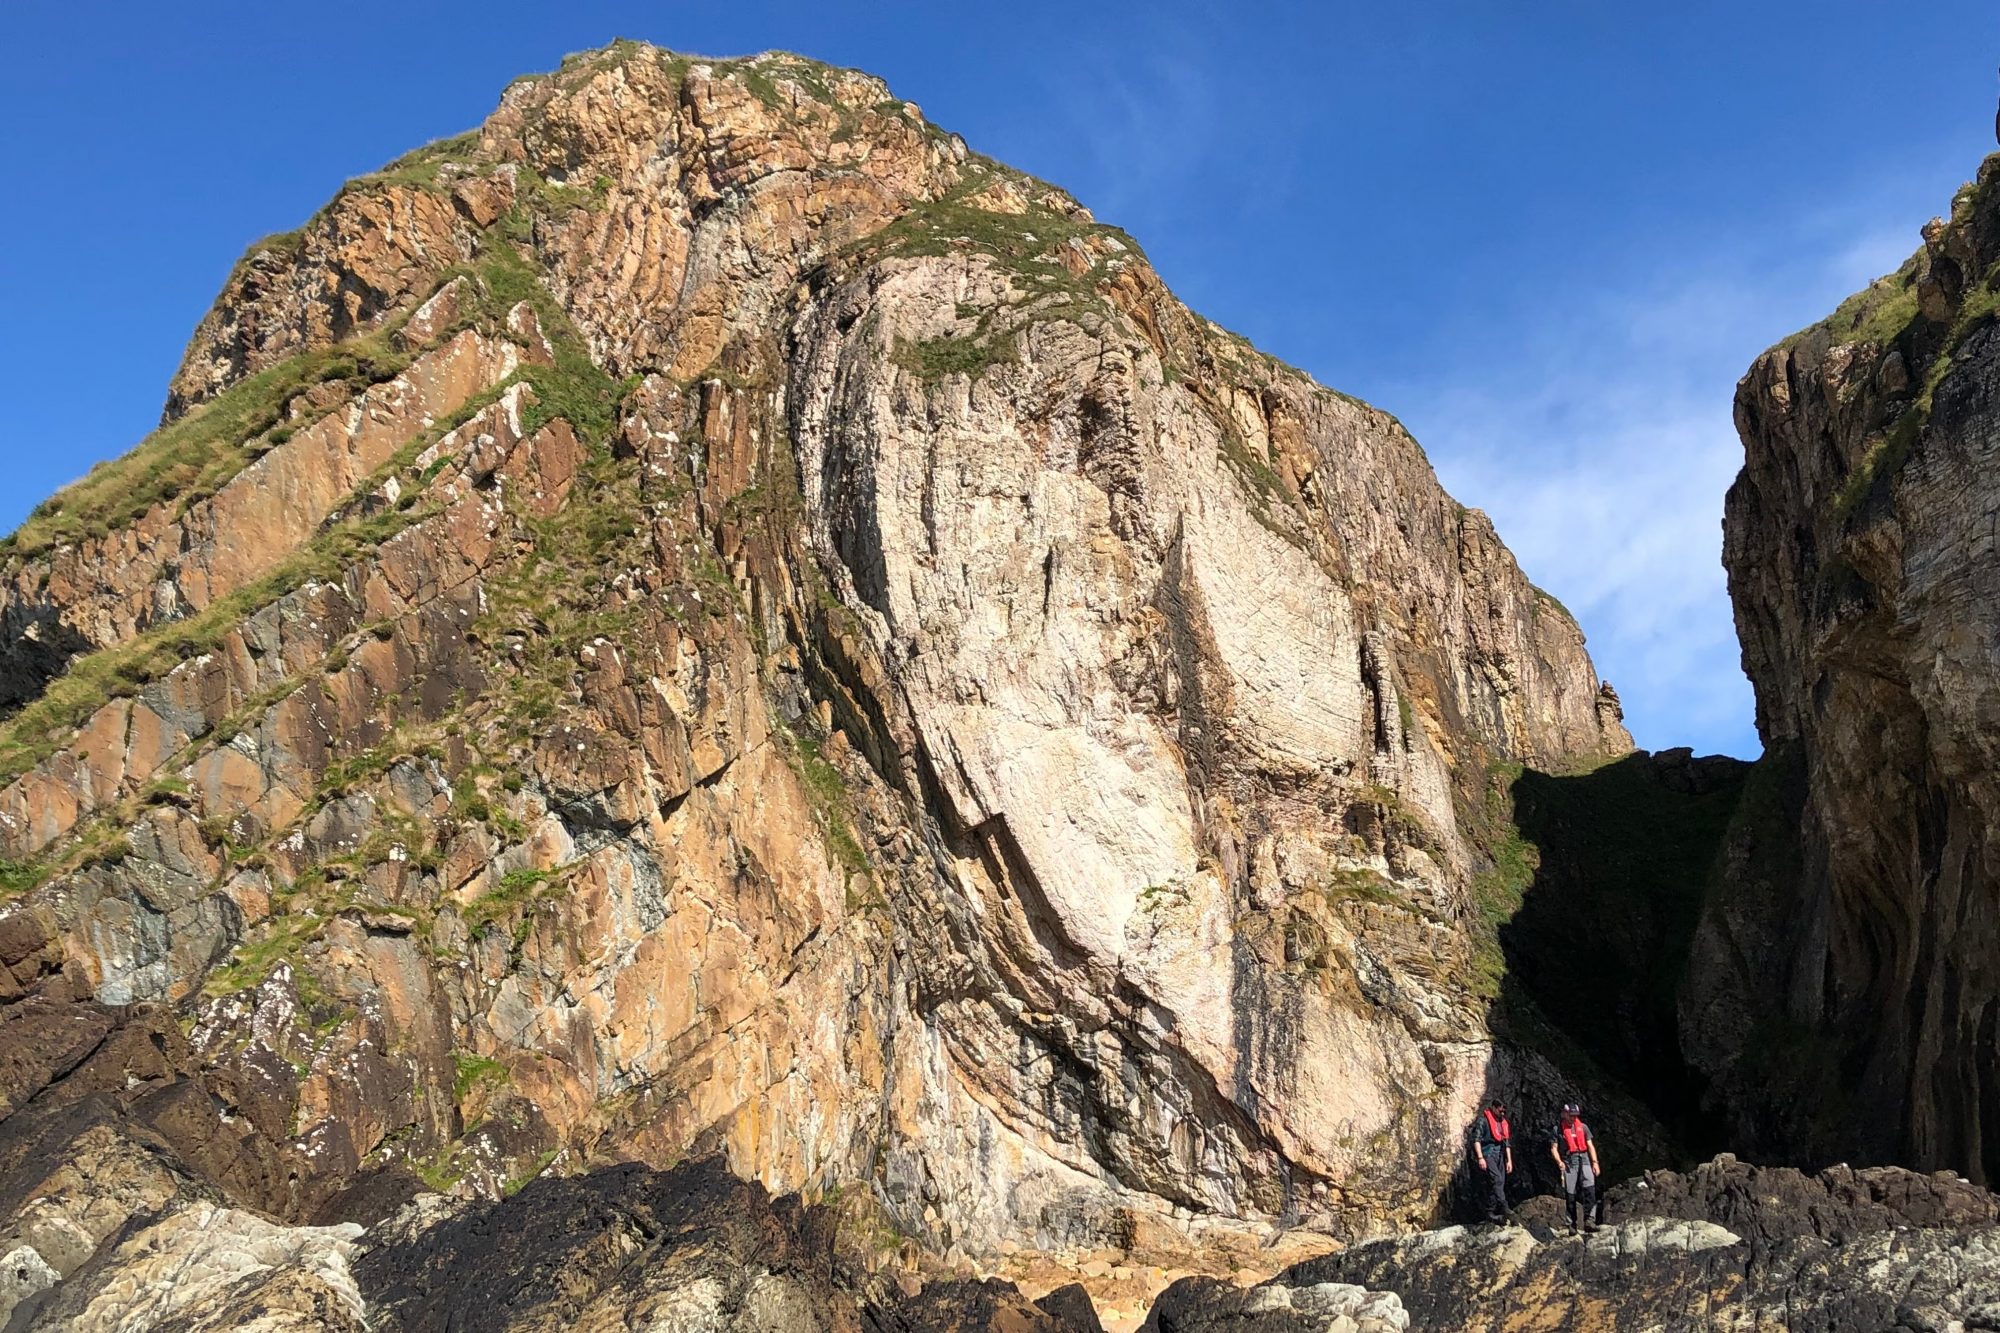
Did these rocks in Scotland escape Snowball Earth? That’s what geologists at the University College of London are claiming. If so they can tell us a lot about that period in Earth’s history. (Credit: The Independent)

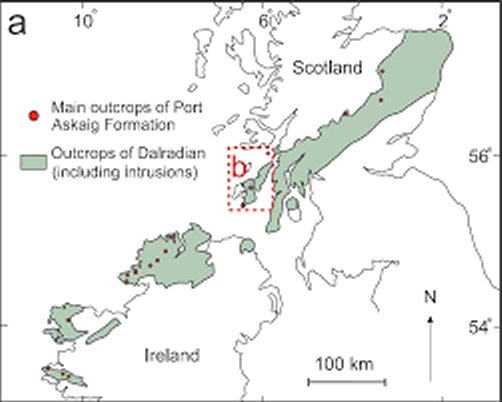
They may now have finally found it. A new study in the Journal of the Geological Society of London by geologists at the University College of London has found that the Port Askaig formation on the Hebrides Islands of Scotland along with portions of Northern Ireland is just that rock sequence. The Port Askaig formation is a 1.1 kilometer thick series of strata that were laid down as sedimentary rock during the Sturtian glaciation period, to give Snowball Earth is technical name and which are underlain by 70 meters of carbonate rock that formed in tropical waters. Which shows that the period right before the snowball was considerably warmer. Those carbonate rocks are teeming with cyanobacteria, the most common form of life on the early Earth.

Spread out over portions of Scotland and Northern Ireland parts of the Askaig Formation lie in areas with little human habitation making the geologists work that much easier. (Credit: Stockholm University www.su.se)

The islands of the Inner Hebrides are generally uninhabited, making the Port Askaig formation a perfect labouratory for geologists to study this critical period in Earth’s history. Perhaps somewhere in these Scottish rocks lies the secret to the environmental conditions that caused the single celled life of Earth to unite into the communities of cells that today we call plants and animals.

Paleontology News for September 2024: Three creatures from the Cambrian period, the time when the kinds of animals we’re familiar with today were first developing. 

The Cambrian period, dating to some 560 to 500 million years ago, is well known as being that time when all of the basic types of animals that inhabit our world today first appear in the fossil record. From the jointed-legged arthropods or the crawling molluscs to the many different kinds of worms they all appear to have become identifiable groups during the Cambrian.

The creatures of the Cambrian Period may look very strange to us but paleontologists can identify many of them as the ancestors of our modern animals. (Credit: Natural History Museum)

The reasons for this sudden explosion of life are still a matter of intense study, the best scenario at present is that it was during the Cambrian that the first ‘hard parts’ of animals evolved, shells and spines for defense, claws and teeth for offense. These new structures initiated an ‘arms race’ amongst early life forms, which led to a great diversification in the kinds of animals there were. 

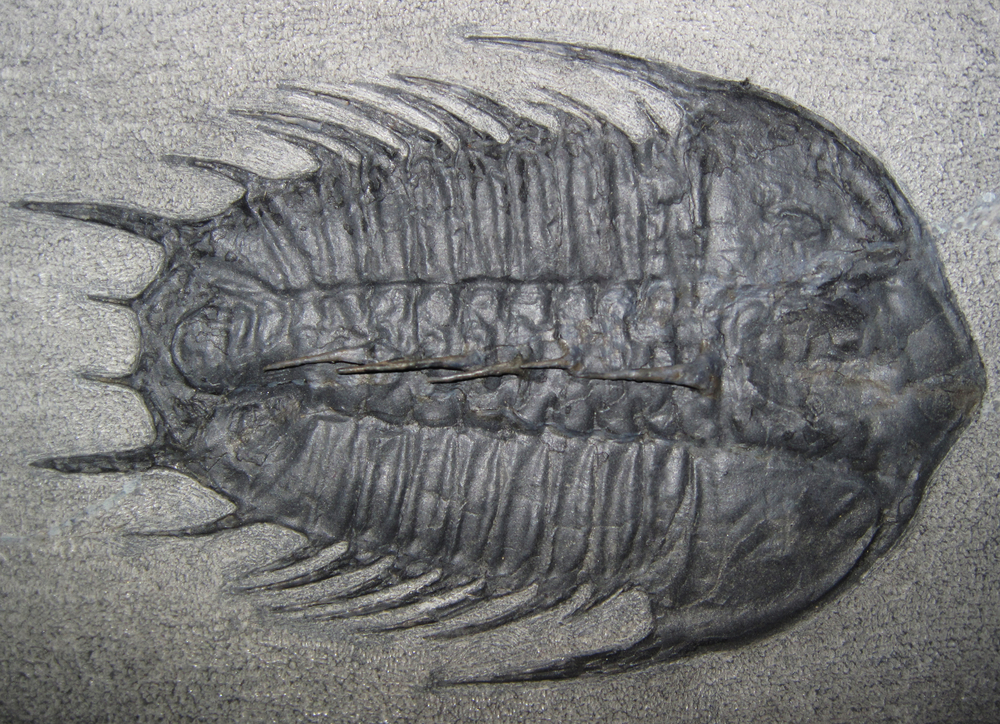
A complete shell of a Trilobite, perhaps the best known of the creatures of the Cambrian. One of the first groups of animals to possess a hard shell they raise the question as to whether it was the evolution of hard parts that led to the Cambrian explosion of life. (Credit: Live Science)

So if the Cambrian period is the time when the major types of animals evolved it is also the time to look for the earliest development of the characteristic features of those animals, the jointed legs of arthropods, the shells of mollusks and etc. In today’s post I will be discussing three newly discovered fossils highlighting the way paleontologists are studying the Cambrian Period but I will not be following my usual technique of discussing the earliest animal first and then moving forward in time because these three creatures may have all lived at the same time.

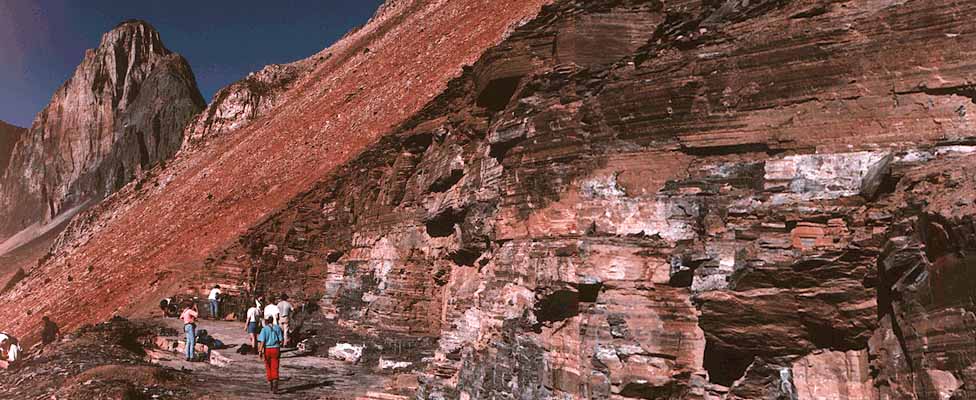
The world famous Walcott Quarry that exposes the Burgess Shale. This outcrop of rocks has revealed so much of the history of early life that it has been given ‘World Heritage’ status. (Credit: University of California Museum of Paleontology)

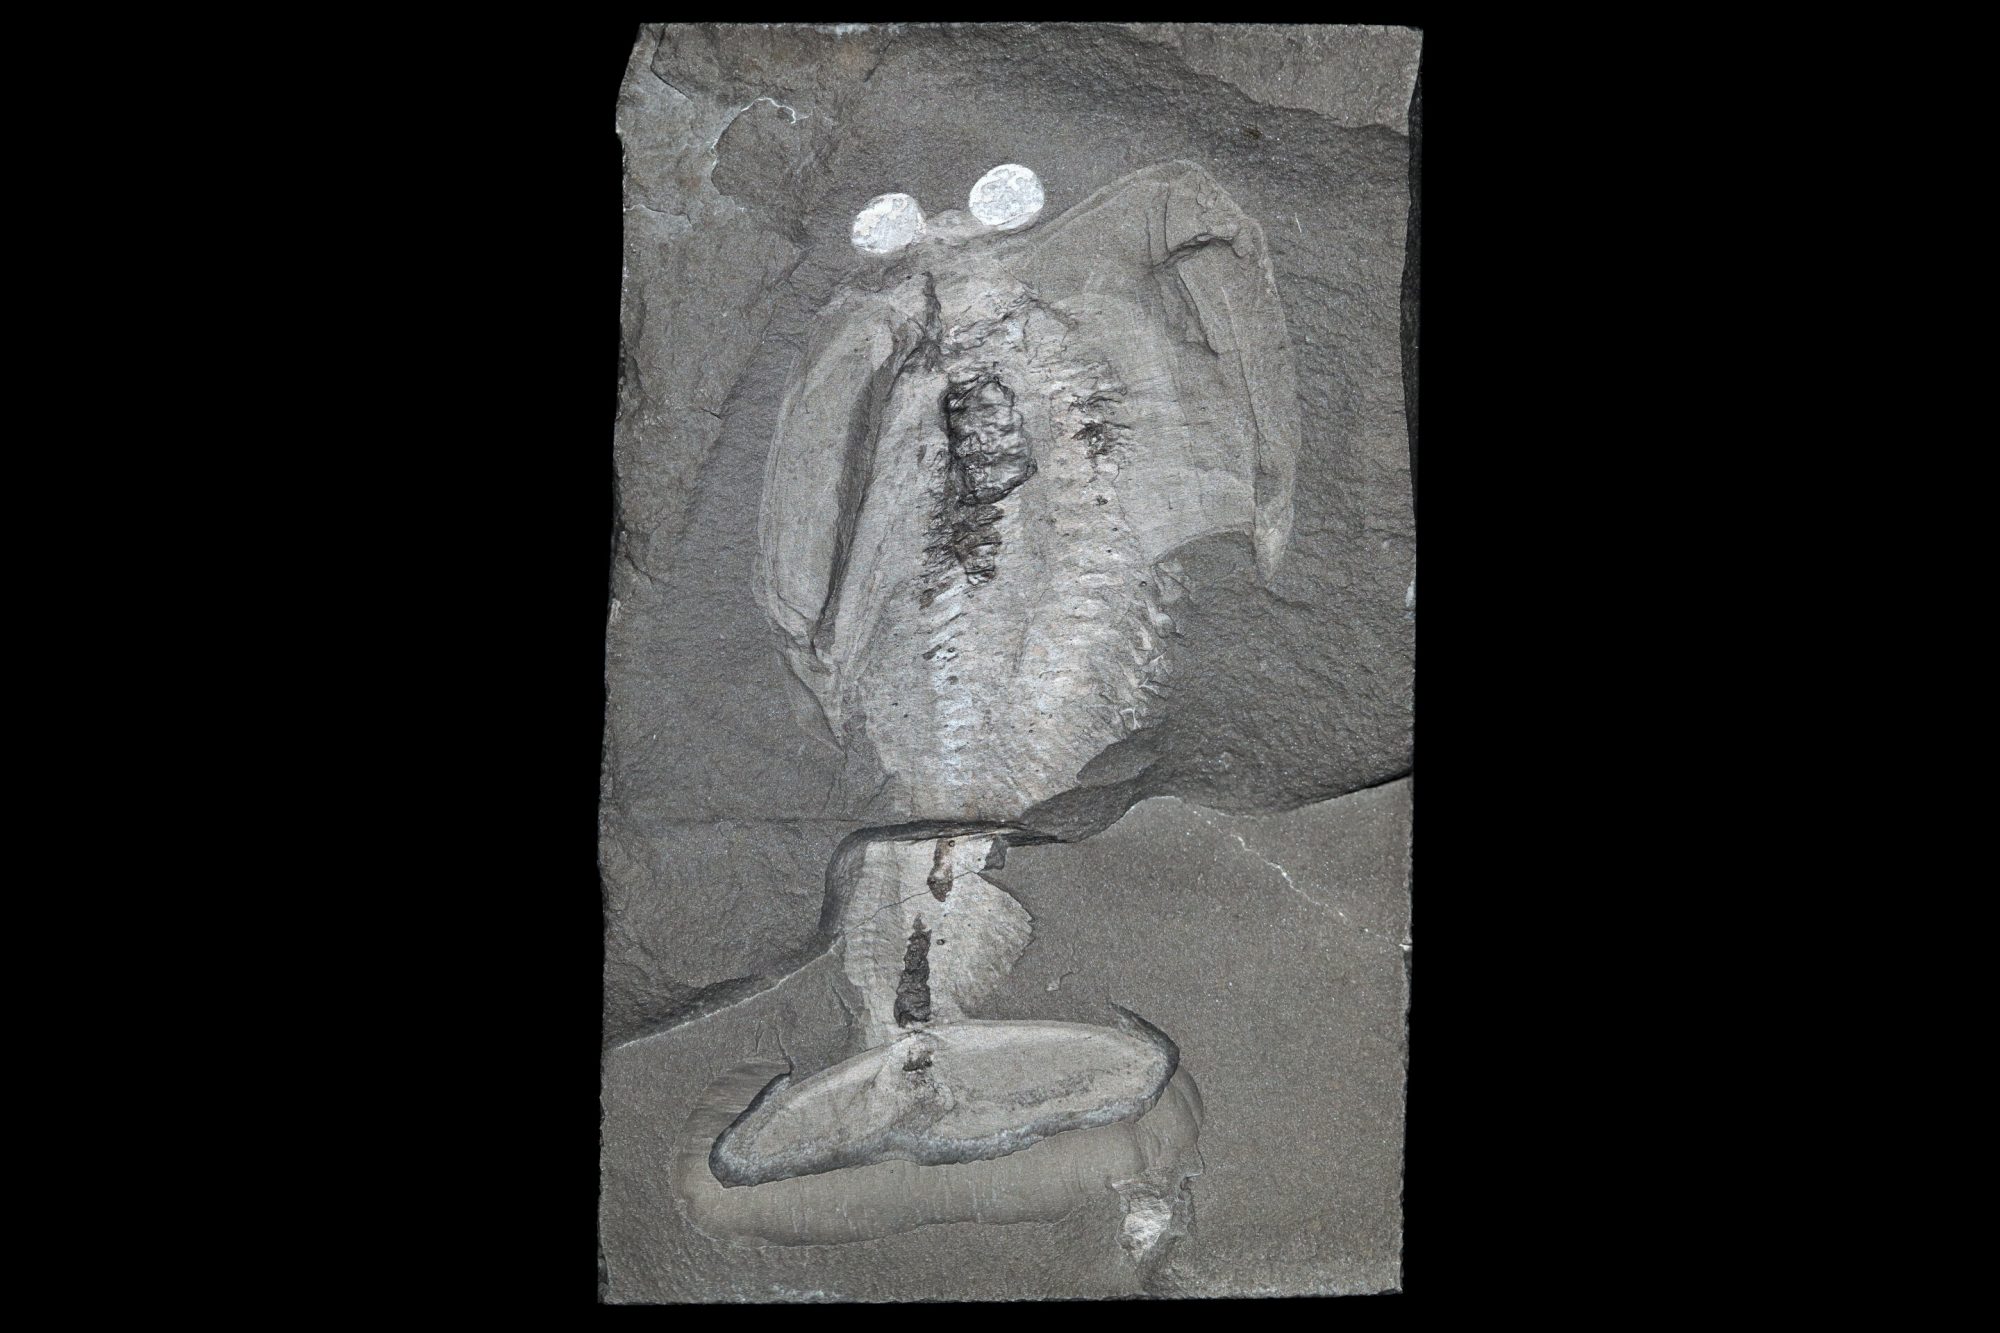
The first creature I’ll discuss is a member of the ‘weird wonders’ from the famous Burgess Shale in British Columbia; see my post of 29 September 2021. The animal is called Odaraia alata although it’s also known as the taco animal because of the distinctive taco-shaped shell that covers the front half of its body. Odaraia was first described over 100 years ago as an arthropod, and at 20cm in length one of the largest. However because only a few specimens were found and because that taco shaped shell covered some of the animal’s most important anatomy, where exactly within the arthropods it belonged remained controversial.

An artist’s illustration of Odaraia alata. The taco like shell contains over 30 pairs of legs that are not used for walking but rather for grabbing particles of food that pass through the shell. (Credit: CBC)

Most paleontologists thought that Odaraia swam through the upper water column capturing food particles in the opening of its shell as it swam but how it caught that food and whether it had mandibles like modern insects and crustaceans or lacked them like the trilobites did was unknown. (By the way did you know that arthropod mandibles, their jaws that is, are actually modified legs? That’s right, insects, crabs, spiders and shrimp all chew with their feet, or rather feet that have evolved in shape to crush and tear rather than walk.)

The jaws or mandibles of insects are actually modified legs! How far back in the history of arthropods this evolved has been a question for a long time. (Credit: Adobe Stock)

Now a new study from researchers at the Royal Ontario Museum (ROM) has succeeded in answering those questions. Using some new specimens and the latest technology the paleontologists have found that Odaraia did have a small set of mandibles near its mouth, making it one of the earliest arthropods to possess them. Also the team discovered that inside of its shell Odaraia possessed 30 pairs of legs that had been modified with numerous spines to capture food passing through the shell. With 30 legs covered in spines Odaraia had a very effective net inside its shell for capturing food.
One of the specimens of Odaraia alata that enabled paleontologists at the Royal Ontario Museum to confirm that O alata did possess mandibles. (Credit: Phys.Org)

One interesting fact about arthropods in general is the way that they often change their shape as they grow and mature, I’m talking about the process of metamorphosis where for example a caterpillar changes into a butterfly. The butterfly is the mature, sexual stage while the caterpillar is the immature or larval stage, very different in shape even though they are the same species. As you might guess paleontologists often have enormous difficulty in connecting fossils of larva to the adult species they mature into. Despite this however paleontologists are always on the lookout for fossils of larva because those immature specimens can tell them a great deal about how the species grows and matures.

You only live twice, at least you do if you’re a Butterfly who begins life as a caterpillar then metamorphizes into a butterfly. (Credit: BBC Wildlife Magazine)

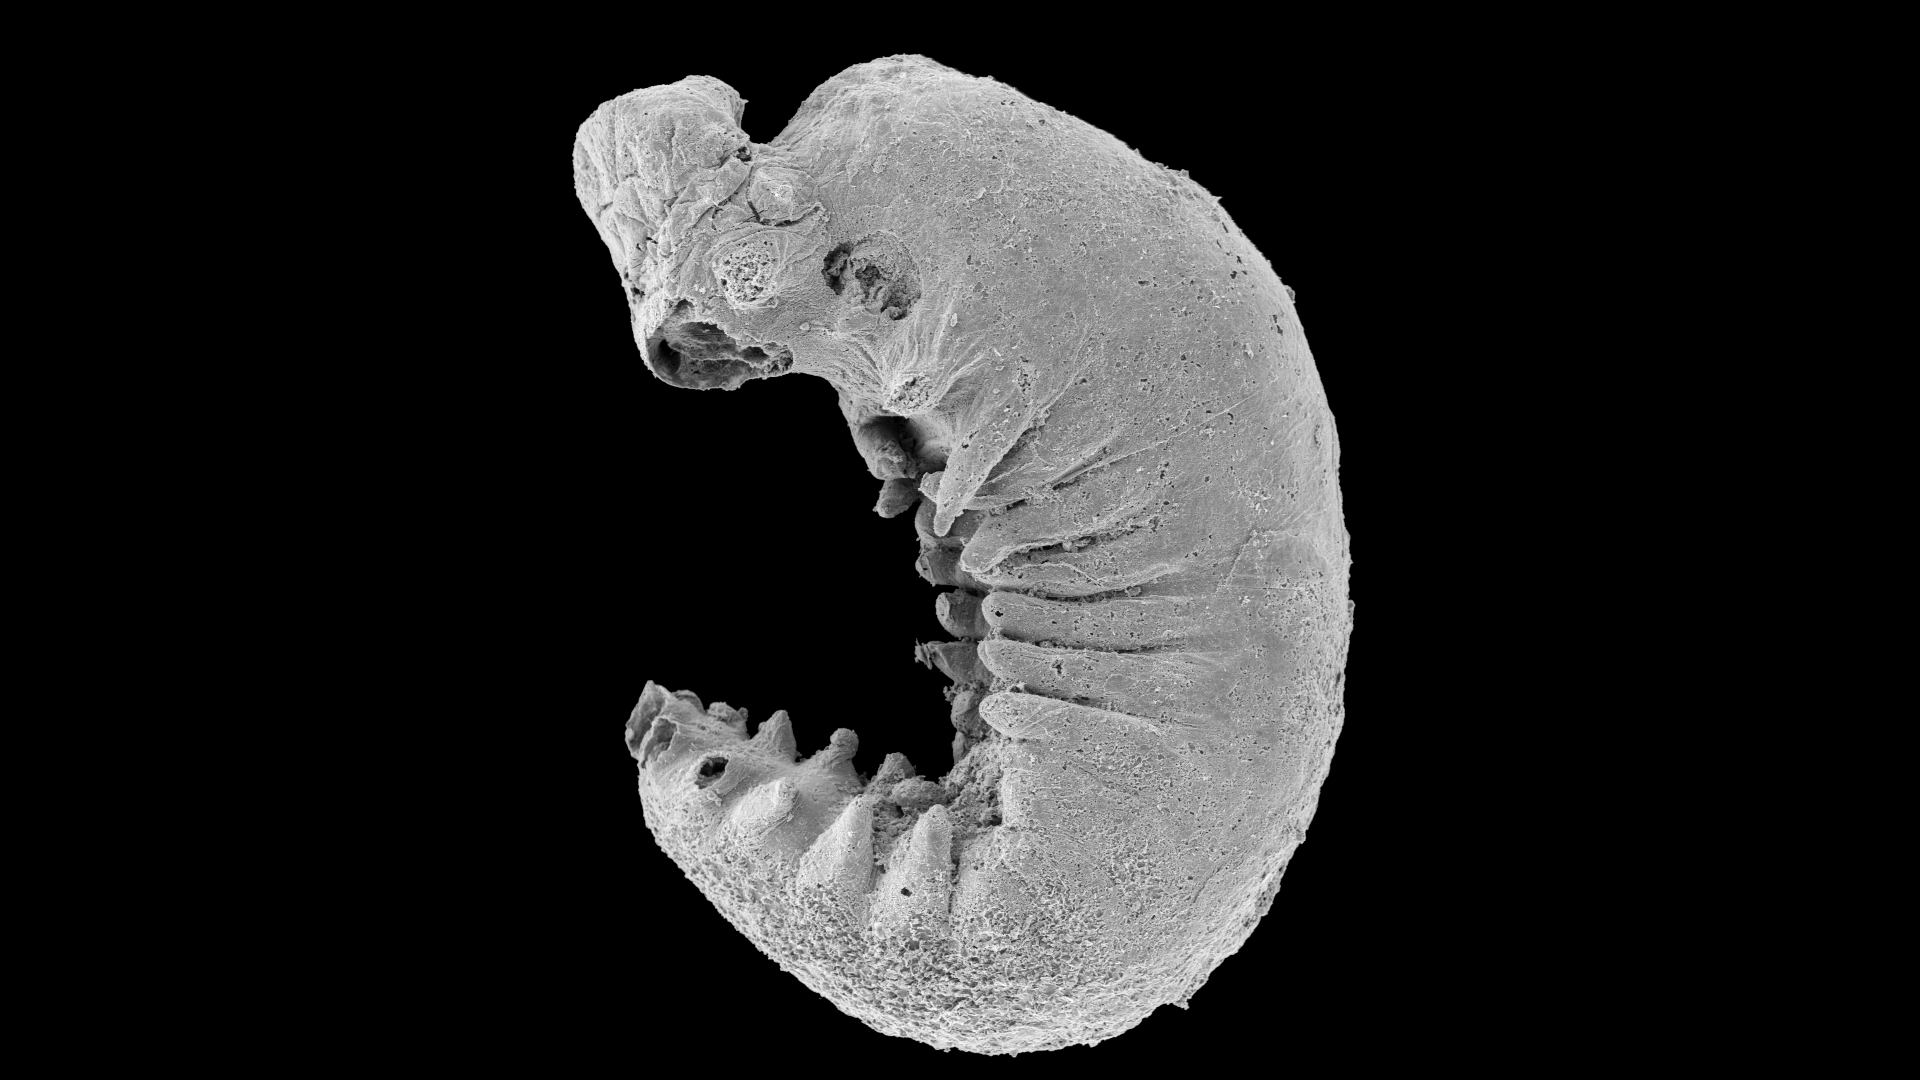
A good example of this comes from a recent paper by Doctor Martin Smith of the Oxford University based upon a larva fossil no bigger than a poppy seed that was discovered in half billion year old rocks from Northern China by colleagues at Yunnan University. The study of microfossils, complete fossils so small you need a microscope to examine them at all, is a science to itself where specimens of fossil bearing rock such as limestone are dissolved in acidic solutions. The tiny bits left over then have to be examined to see if any are interesting fossils, a job that requires a great deal of work and patience.

No bigger than a poppy seed this fossil larva from 520 million years ago is teaching us a great deal about the life cycle of ancient arthropods. (Credit: Live Science)

As soon as they saw the specimen the researchers at Yunnan knew they had found something special. First of all they could see that it was an arthropod larva of some type, and in addition the specimen was so well preserved that, even though it was only the size of a poppy seed, it might still have evidence of the internal structure of the animal. The problem was that Yunnan University did not possess the necessary equipment to examine the inside of the fossil.

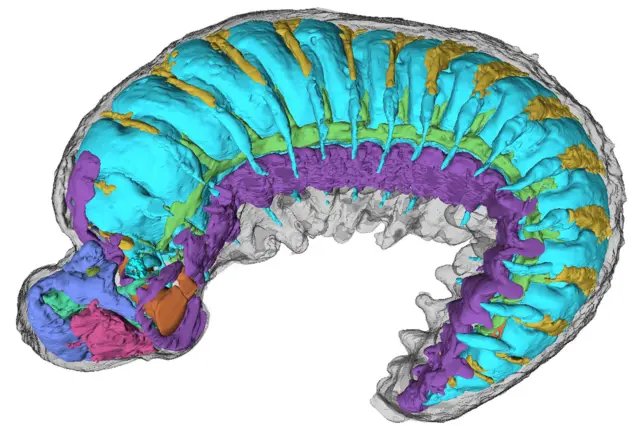
A colourized X-Ray image of the larva reveals a lot of the details of the animal’s internal structure. (Credit: BBC)

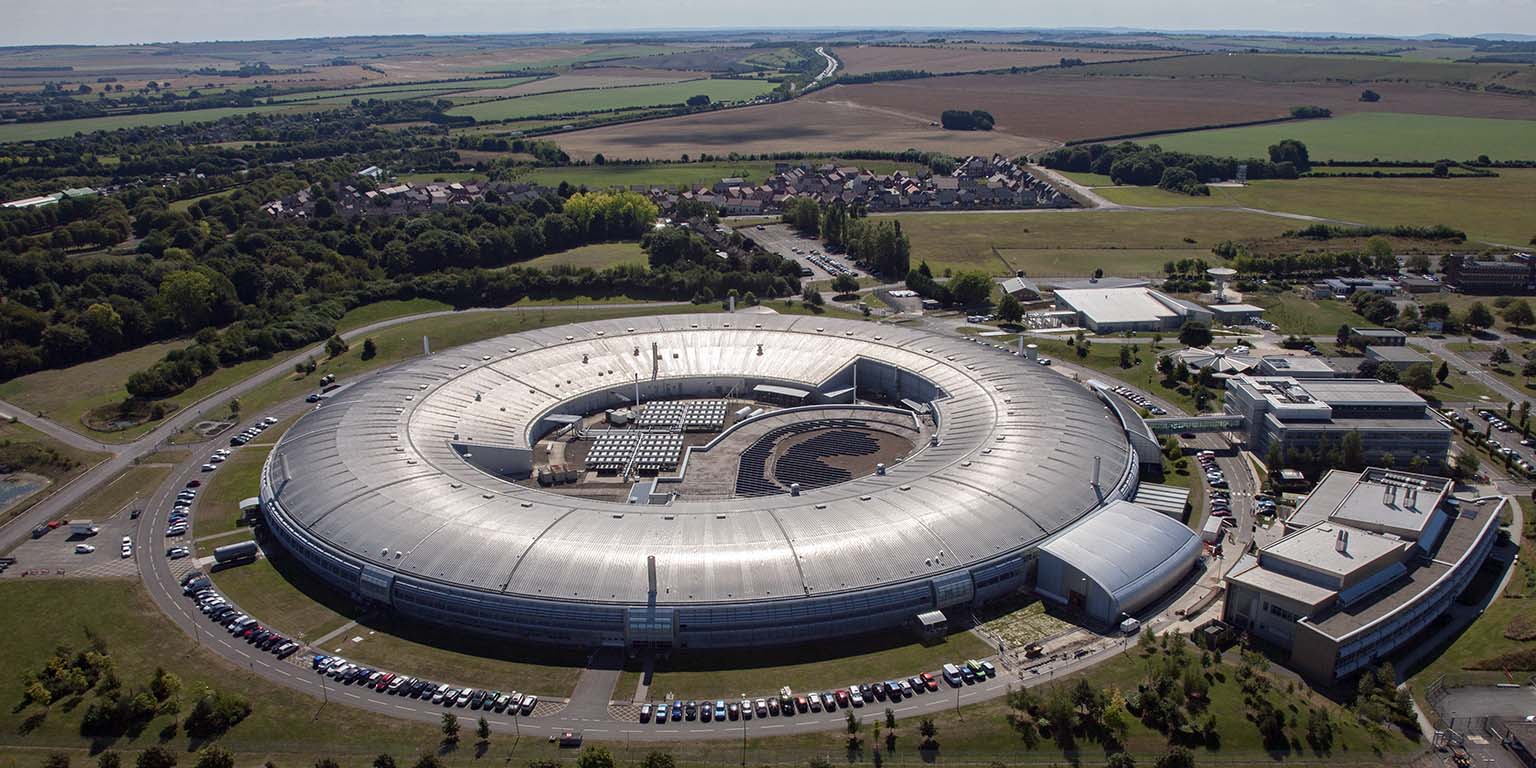
Enter Dr. Smith, who was well acquainted with Oxford’s Diamond Light X-ray Source. The paleontologists at Yunnan allowed Dr. Smith to take the larva specimen back to England where much of its internal structure were revealed in Smith’s lab. Despite its small size the fossil’s X-rays revealed a developing brain cavity, traces of the digestive system along with the circulatory system and even nerve endings to the legs and eyes. The 500 million year old larva has given paleontologists new insights into how the ancestors of today’s insects, crustaceans and other arthropods grew and matured.

An X-Ray machine so large and complex it needs a building this big to hold it. That’s Oxford University’s Diamond Light X-Ray Source. (Diamond Light Source)

Finally today I’ll discuss a recent paper about a 510 million year old fossil animal from a completely different group of animals, the mollusks, but by a coincidence from the same two Universities, Yunnan in China and Oxford in the UK.

We’re all familiar with mollusks, particularly the shelled variety of bivalved clams and oysters along with single shelled snails. Just how the earliest mollusks first developed their shells is a subject of considerable study.

Just a few of the many different kind of bi-valve Mollusks that we love to eat. (Credit: Clovegarden)

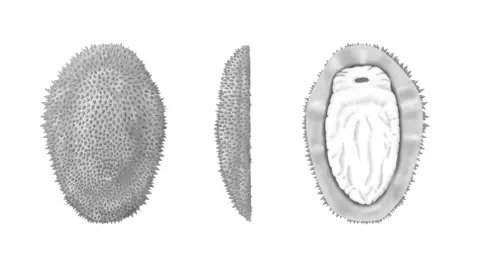
That’s what makes the specimens discovered at a road building site outside of Kunming China by Yunnan University Paleontologist Guangxu Zhang so interesting. Looking like a slug covered by hollow spines the animal, which has been given the name Shishania aculeata, gives paleontologists clues about how the earliest molluscs evolved their shells.

514 million year old Mollusk shell Shishania aculeata (l) and a closeup of its spines (r) (Credit: SciTechDaily)

“The spines, which might also have been sense organs, probably helped Shishania and other molluscs to avoid predators as they crept along the Cambrian sea floor,” according to Luke Parry, a paleontologist at Oxford University who also contributed to the paper. “The fact that we have any of these fossils is pretty amazing.”

Artists impression of Shishania aculeata, something like a snail with a very simple shell or a clam with only one shell it reveals some of the details of how Mollusk’s evolved their shells. (Credit: BBC)

If you think about it, it’s pretty amazing that we have any of these wonderful fossils of animals that lived, and died a half a billion years ago.

Physics News for September 2024: Physics in the Shower and new measurements confirm that Earth’s Magnetic Field is undergoing rapid change. 

One of the best known tales in the history of science relates how the ancient Greek mathematician Archimedes discovered his principal of buoyancy when he stepped into his bath. Noticing the water that had overflowed onto the floor Archimedes realized that the volume of water that was displaced was equal to the volume of his body that had been submerged and the scientist had the solution to his problem. Overjoyed Archimedes got out of his bath and ran naked through the streets of Syracuse crying “Eureka” which is Greek for “I found it!”

As he stepped into his bath Archimedes realized that he could measure the volume of any solid object by the volume of water it displaced! (Credit: Dreamstime)

Recently a physicist with the California Institute of Technology named Amnon Yariv had an experience somewhat like that of Archimedes while taking his shower at his home in Pasadena, California. Having one of those shower heads that are at the end of a long flexible hose Yariv noticed that when he let the head hang free the force of the flowing water caused it to not only swing back and forth like a pendulum but also twist clockwise and anti-clockwise. Doctor Yariv, who is an expert in Oscillations and periodic motions quickly recognized this behaviour as bimodal, that is two distinct oscillations were moving in synch with each other. Doing a little experimenting Yariv soon discovered a few other interesting characteristics of his phenomenon, one was that the two oscillations were also coupled, any dampening of one would cause a dampening of the other. Also, if he increased the water flow of the shower beyond a certain point the two oscillations began to grow wildly, uncontrollably. Doctor Yariv likens his discovery to two tango dancers, who have to coordinate their dancing with their partner in order to avoid tripping over each other.

Physicist Amon Yariv of Caltech. (Credit: Caltech)
Dr. Yariv in his shower experimenting just like Archimedes did! (Credit: Caltech)

Having discovered his new phenomenon Doctor Yariv spent the next several years modeling it mathematically while also performing some experiments to confirm his model. According to Yariv his oscillation is an bimodal extension of a class of oscillations that were studied by Lord Rayleigh and Michael Faraday a century and a half ago in which a system is excited by a modulation at twice the resonate frequency of the system.

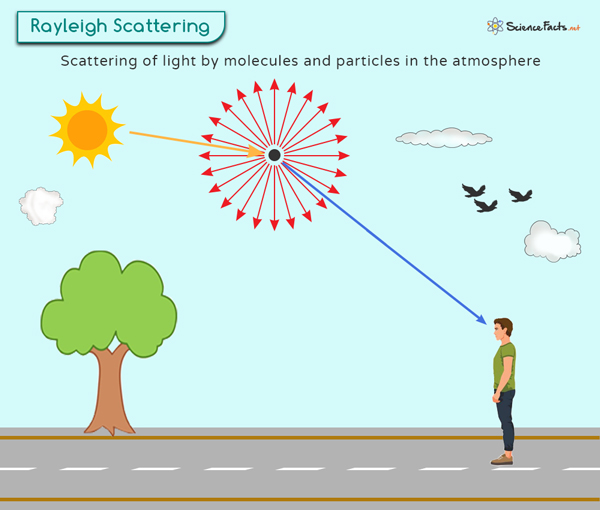
Lord Rayleigh is also the physicist who first worked out the reason why the sky is Blue. Today we call that Rayleigh scattering. (Credit: Science Facts)

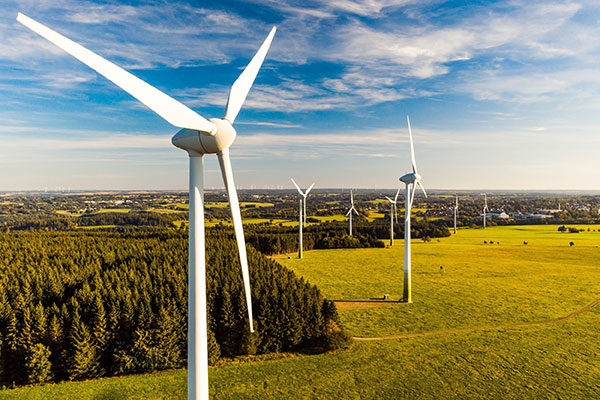
Doctor Yariv was also able to obtain useful work from his oscillations by coupling it to a rotary gear. He hopes that his research may lead to more efficient energy conversion from wind turbines and other green energy systems. Not bad for something discovered in the shower!

The rotation of the blades on a wind turbine are a form of oscillation. Dr. Yariv hopes that by better understanding his double oscillation it may be possible to improve the efficiency of wind turbines! (Credit: Just Energy)

Most of the discoveries made by physicists today however require a bit more equipment than a showerhead, often very expensive equipment, even equipment on satellites in outer space. The mystery of Earth’s magnetic field for example has been studied by hundreds of physicists over the last several hundred years with some of the most precise instruments available yet we still known only a little about it. We do know that the core of our planet is composed mainly of liquid iron and nickel, both magnetic materials, and that as our planet spins on its axis currents in that molten core can generate a magnetic field.

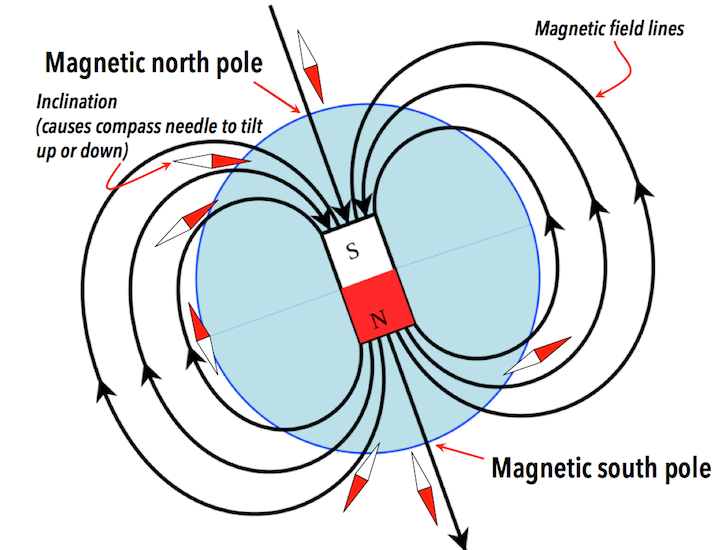
A simplified view of Earth’s magnetic field. Once again, since the north pole of your compass points north that means that there is a south magnetic pole up there!!! (Credit: BC Open Textbooks)

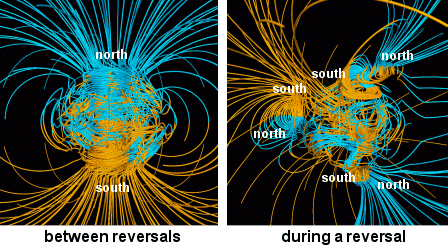
Another thing that we’ve discovered is that every couple of hundred thousand years or so our planet’s magnetic poles swap their positions, the one up north going south and the one down south going north. (By the way, since opposite poles of a magnetic attract each other while similar poles repel, and since the north pole of a compass points north that means that currently there is a south magnetic pole up north and a north magnetic pole down south.)

For reasons unknown every couple of hundred thousand years or so the Earth’s magnetic poles reverse their positions. Right now our planet’s magnetic field is starting to look like the figure on the right. (Credit: NASA Science)

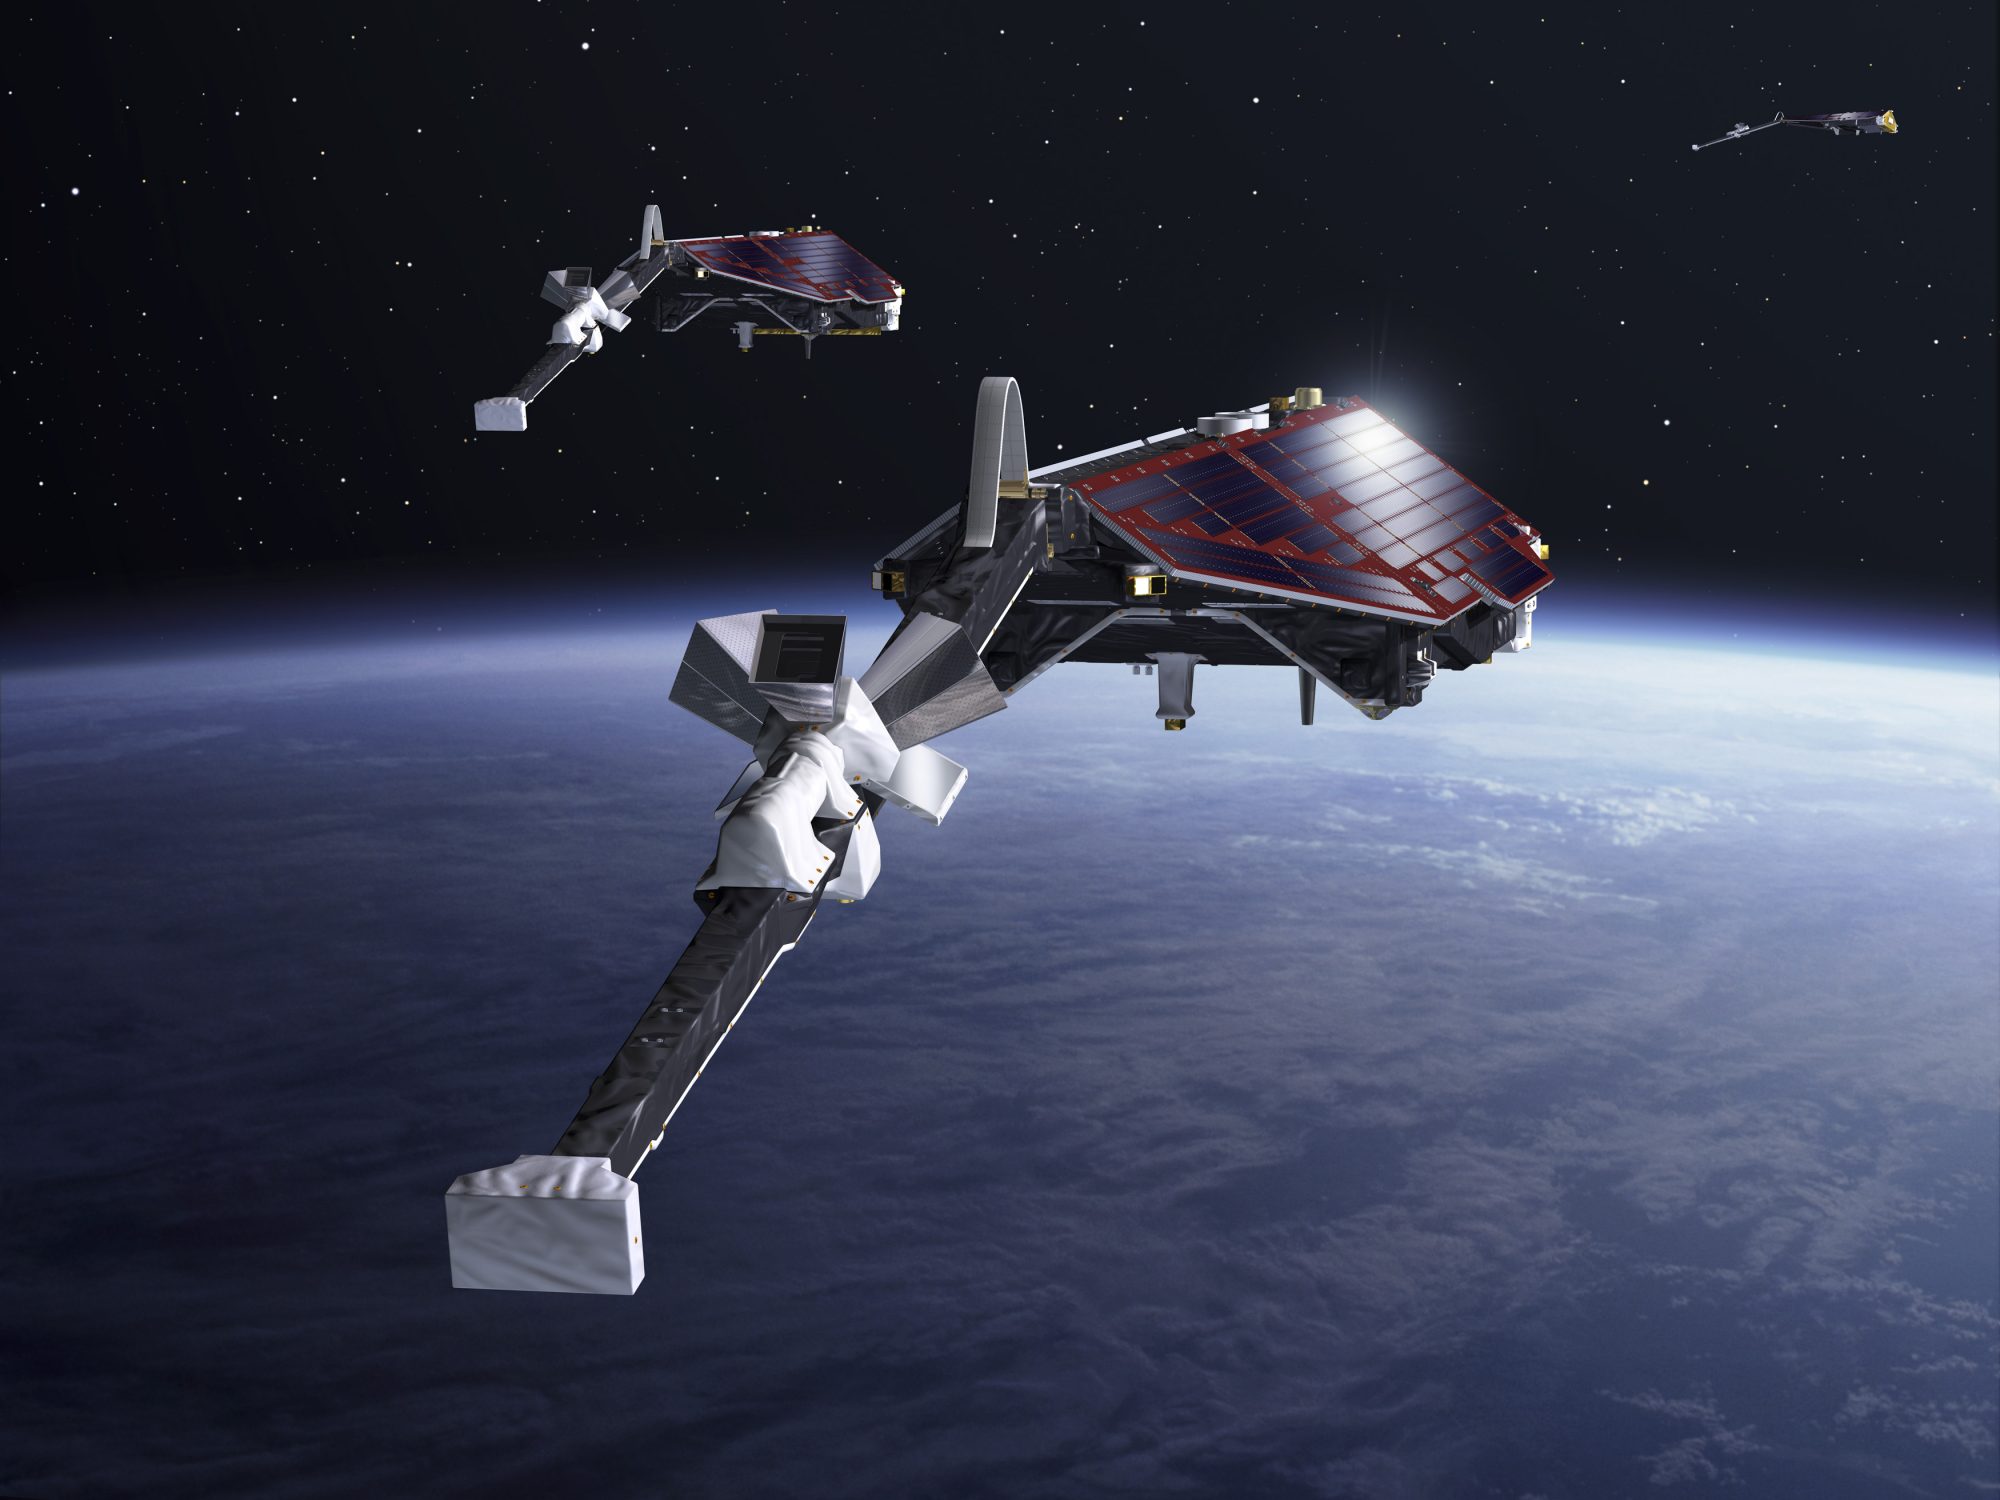
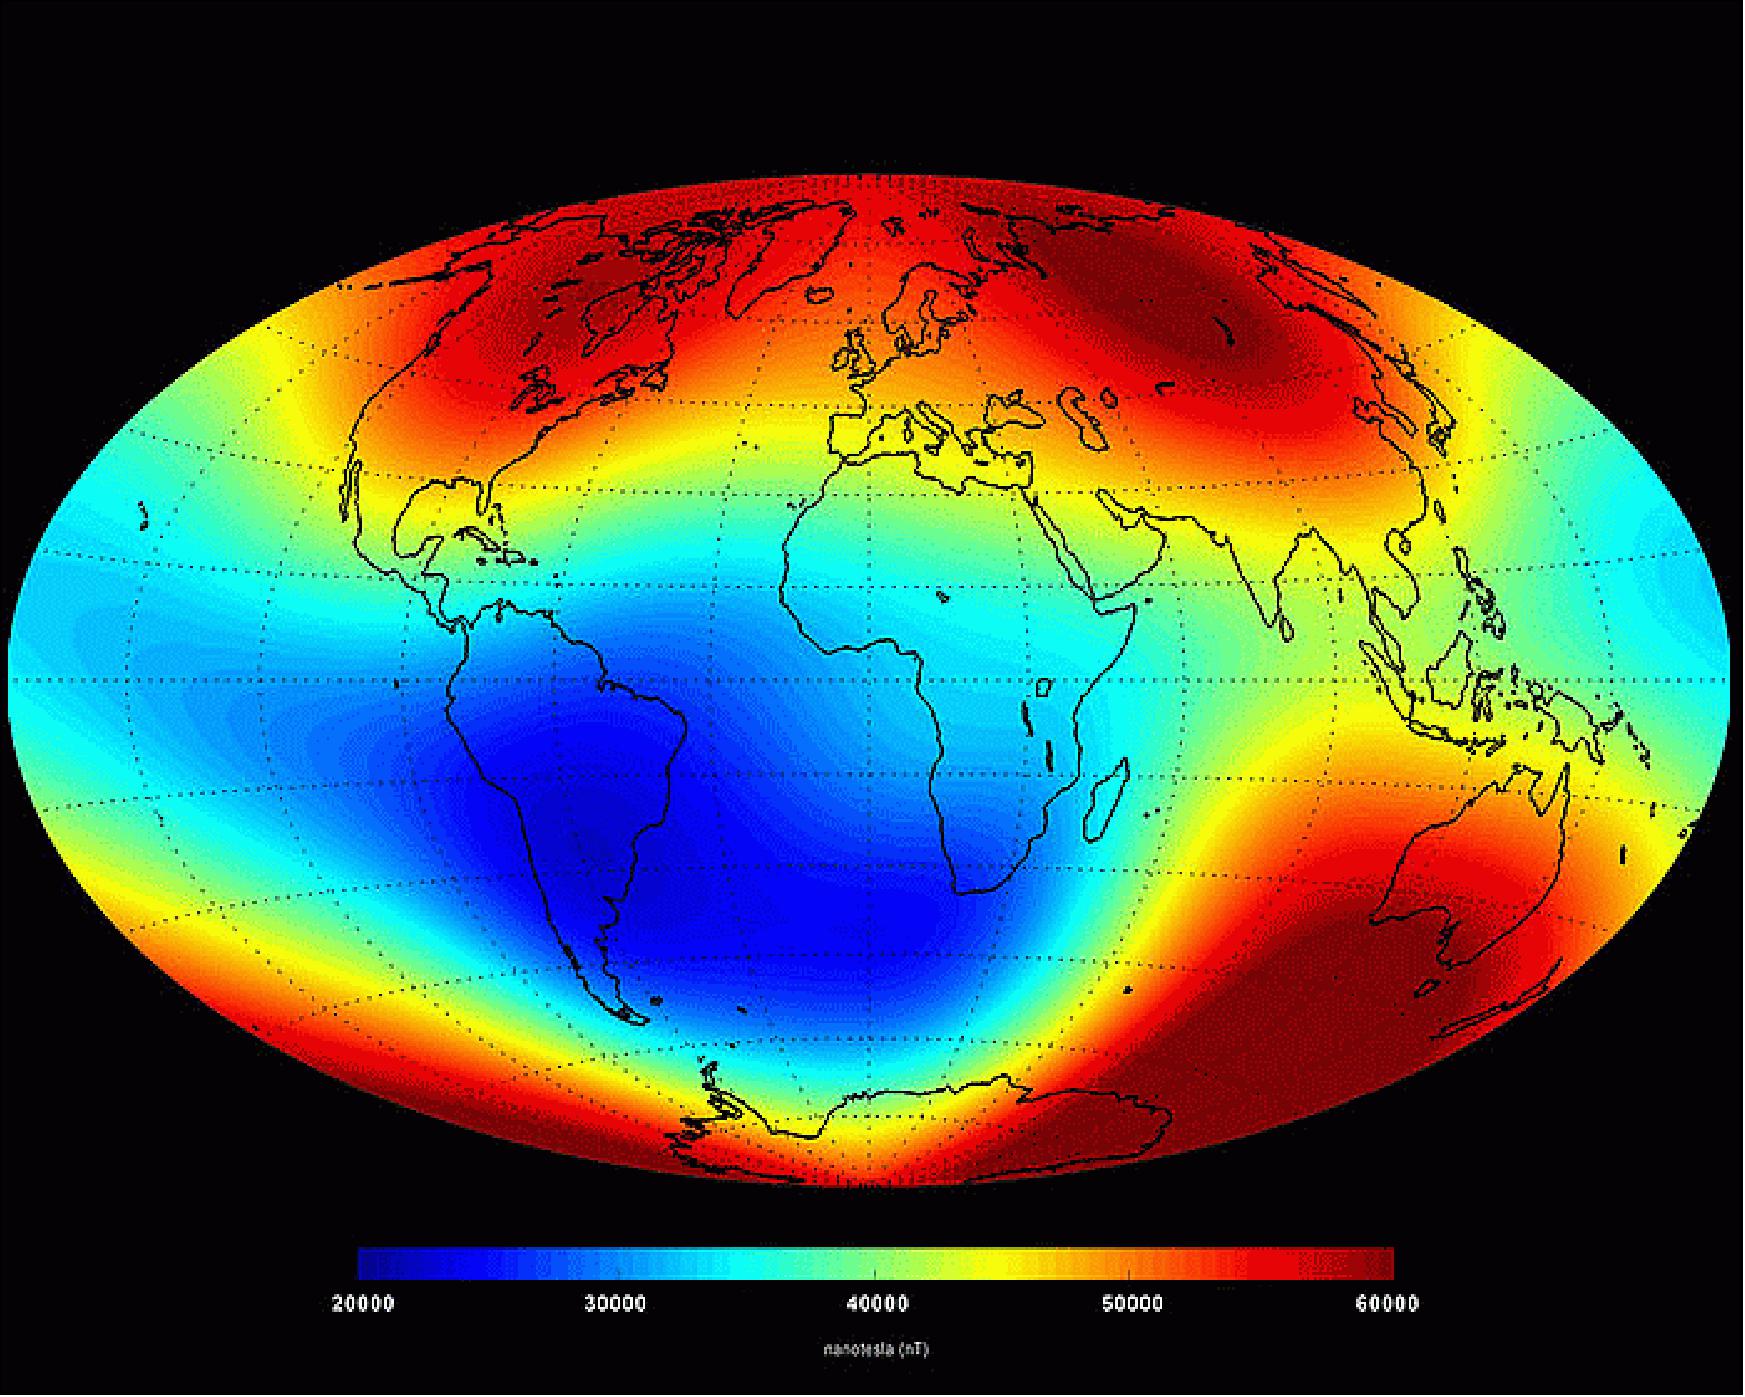
Over the past several decades measurements of the Earth’s magnetic field have shown a steady decline in the strength of that field leading many researchers to think that Earth may be in the initial stages of one of those magnetic pole swaps. In order to get a more precise idea of just how rapidly the Earth’s magnetic field is changing in 2014 the European Space Agency (ESA) launched three satellites that they called the Swarm Constellation that were designed to make the most accurate measurements of our planet’s magnetic field. Over the next six years the satellites made detailed and comprehensive maps of the Earth’s magnetic field from Low Earth Orbit (LOE) and just as importantly monitored how the magnetic field was changing!

The three satellites of the European Space Agency’s ‘Swarm Constellation’. Together these satellites are monitoring the changes in Earth’s magnetic field. (Credit: European Space Agency)

That data has now been analyzed by researchers at the University of Michigan’s department of Climate and Space Sciences and Engineering and compared to the latest model for how we think the Earth’s magnetic field works. That model is known as the International Geomagnetic Reference Field or IGRF-13, the 13 meaning that this is the 13th model in a series. A report on that analysis has recently been published in the Journal of Geophysical Research: Space Physics.

Image depicting the data collected by the Swarm Constellation satellites. It obvious that Earth’s field is no longer a nice simple one pole up the other down! (Credit: eoPortal)

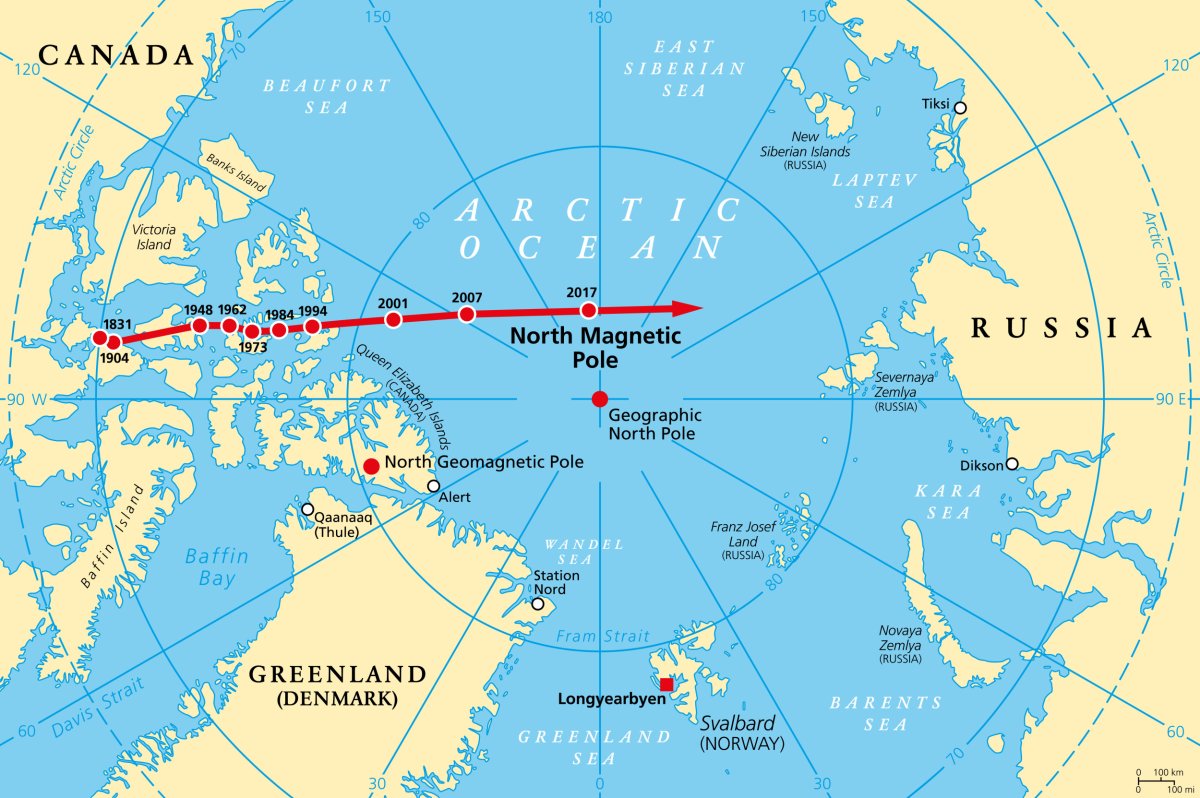
Through their examination of the data from the Swarm Constellation satellites the researchers discovered a number of discrepancies between the data and the model many of which were caused by a surprising error in the model. You see, although the physical North and South Poles, as defined by the Earth’s axis of rotation, are exactly on opposite sides of our globe, the same is not quite true of the North and South magnetic poles. Currently the north magnetic pole is situated at 84º of latitude and 169º of longitude, for the south magnetic pole to be exactly opposite it on our globe it would have to be at -84º and 11º of longitude but it is in fact at -74º latitude and 19º longitude. At least some of the reason for this asymmetry in Earth’s magnetic field comes from the observed fact the both magnetic poles move, currently the north magnetic pole is moving at a speed of about 45km per year.

We’ve known for over a century that the North Magnetic Pole was moving but for decades it moved very slowly. Recently that motion has accelerated and the pole is racing across the polar region. (Credit: Newsweek)

The discovery of this error in the model will certainly help with further improvements in the model but another find by the scientists may be even more important and that is the speed with which the Earth’s magnetic field is changed. As outlined in the report noticeable shifts in both the strength and polarity of the magnetic field can be observed even over as short a period as six months. In fact the rapid changes in the magnetic field are already causing problems in navigation for both ships and aircraft, especially for those whose paths take them close to the Polar Regions.

Compass, Sextant and Telescope, the instruments seafarers used for centuries to navigate their way around the world. What happens when the Compass is no longer so accurate? (Credit: Adobe Stock)

Earth’s magnetic field is a dynamic phenomenon whose pace of change is increasing. In the years to come those changes could impact our daily lives in other ways than just making navigation more difficult. Only by learning more about our planet’s magnetic field physicists can we prepare ourselves for the changes to come.