Although we travel on them every day we scarcely ever think about the roads that lay right outside our door but which can literally take us almost anyplace on Earth. The idea of roads connecting towns and cities together is so natural that we almost forget that every one of them is artificial, man-made, often at great cost and effort.
Throughout history road building has been an expensive but very necessary part of civilization. Those societies that have been successful have always been those who built roads. (Credit: Propeller Aero)
Roads are an essential part of civilization. We humans are a traveling species and whenever we choose to go someplace, or move some of our material goods someplace, roads just greatly facilitate that movement. Stone Age people followed the easiest path they could find but as soon as civilization got started people began making roads between cities to speed up travel and trade.
As our ancestors spread around the globe they followed the natural paths made by animals or streams. Since the dawn of civilization however we have built roads to speed up our travel. (Credit: SUGI Project)
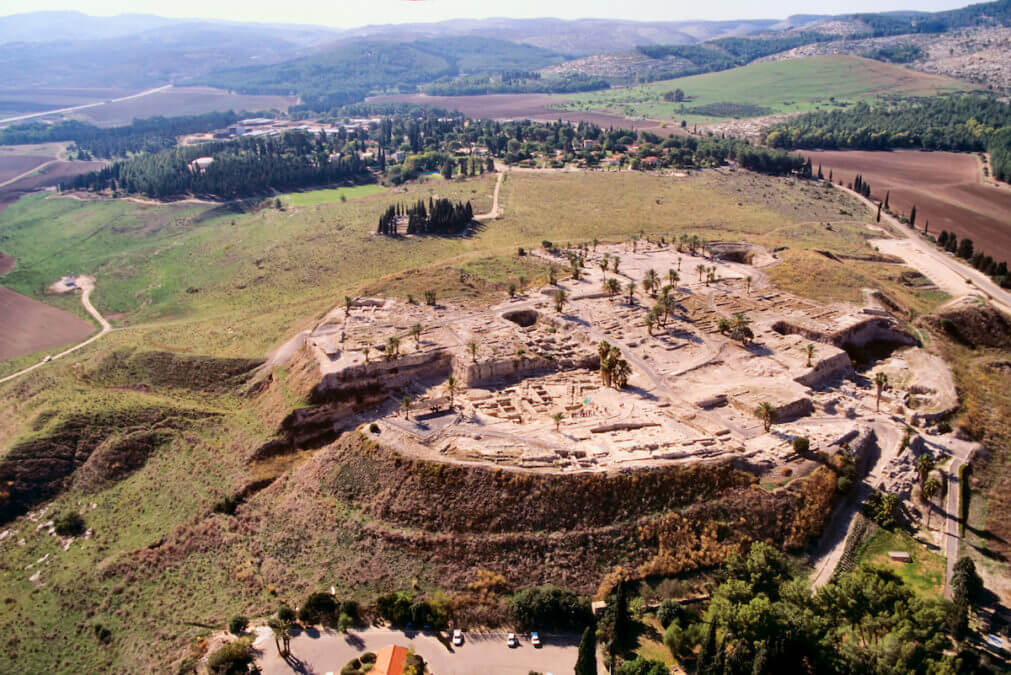
Historically we know of roads that existed from the Bronze Age. One road in particular went north out of Egypt to the town of Megiddo in northern Israel, the biblical Armageddon. There the road split with one branch continuing north to the Hittite empire in Modern Turkey while the other branch went east into ancient Mesopotamia.
One of the most ancient and important roads split at a small town called Megiddo. So important was this site that Megiddo was fought over time and again so that, by its Greek name Armageddon it has become a byword for the final battle to end time. (Credit: Wayne Stiles)
The Romans were famous road builders; wherever their legions went in their conquests they built roads. Every legion possessed at least one officer who was trained as an engineer so that the army could build roads and bridges. One of the strengths of the legion was its speed and the legions got that speed by means of the roads they built throughout the empire. Now I’m not saying that the Roman foot soldiers did all the work of road building, sometimes they did but just as often they forced the local population to do most of the menial labour.
The Romans not only built a lot of roads they built really good roads, many of which were so well built that they have lasted thousands of years. (Credit: ZME Science)
The Romans built their roads so that their army could quickly move from place to place but once built those same roads could be used to transport people and goods from place to place in the Roman Empire. In fact for much Roman period the roads away from the frontiers rarely saw a legionary’s sandal, most of the traffic consisted of the wheels of carts or the hooves of livestock.
The Romans were proud of their accomplishments at road building, even picturing traffic on them in stone carvings. (Credit: web.sas.upenn.edu)
Roman roads were so well built that there are still hundreds of kilometers of Roman road remaining in various countries of Europe. At the same time many modern roads in Europe follow the same route as an old Roman road. Roman roads knitted together an empire of dozens of different ethnic groups and kept them knitted together for hundreds of years.
The major Roman roads that brought their empire together. (Credit: www.landesgeschichte.uni-goettingen.de)
Historians and archaeologists have studied Roman roads for hundreds of years now, in some sense since the fall of Rome itself. Recently a new study in the journal Scientific Data has been published that catalogues over 300,000 km of Roman road, 100,000 more than previously known. The study was led by Dr. Pau de Soto of the Autonomous University of Barcelona in Spain and includes an interactive map of the study’s result that has been christened Itiner-e. The interactive map is available for use by the public and not only includes the map itself but also images and animations that allow students to visualize the Roman roads in the empire’s heyday about 150CE.
An actual Roman road that still exists in England after thousands of years. It still looks quite usable. (Credit: Roman Britain.Org)
While many of the principal Roman roads, like the Appian Way in Italy were well known the study concentrated on the secondary routes connecting small towns or even individual farms and villas. Along with historical references the researchers made extensive use of satellite images and even old WW2 aerial photographs looking for traces like a roadcut through a hillside or differences in vegetation forming a linear tract. According to co-author Tom Brughmans the effort became “A massive game of connecting the dots on a continental scale.”
The allies in WW2 took thousands of aerial photographs like this one. Today these images are a treasure trove of information for historical researchers such as those searching for lost Roman Roads. (Credit: The Digital Collections of the National WWII Museum)
While the study dealt exclusively with Roman roads it must be remembered that Roman infrastructure also consisted of bridges, seaports, aqueducts and many other structures. Like the Roman roads some of these engineering projects still exist today and can be seen in many places in Europe. At its height the Roman Empire possessed a level of technology that the world would not see again until the 17th century. The ancient Romans were of course followed by the Dark Ages and some of the reasons why that era was so dark was because of the collapse of the Roman infrastructure, especially the Roman roads.
Today’s Portugal was at the far end of the Roman empire but even here the Romans built roads and bridges that are still used today! Perhaps the reason that the Roman Empire lasted so long was simply because of good engineering! (Credit: Following Hadrian) Compare this road in Minnesota with the Roman road pictured above. We have neglected our roads the way we have neglected so much in the US today and so our empire is likely to collapse a lot sooner than the Roman’s did! (Credit: MinnPost)
In the US today we have neglected our infrastructure for the last 50 years, allowing our roads and bridges to fall into disrepair while failing to replace water pipes and our electrical grid. If we continue on this course it’s likely that we too will fall the way the Romans did leading to another Dark Age.
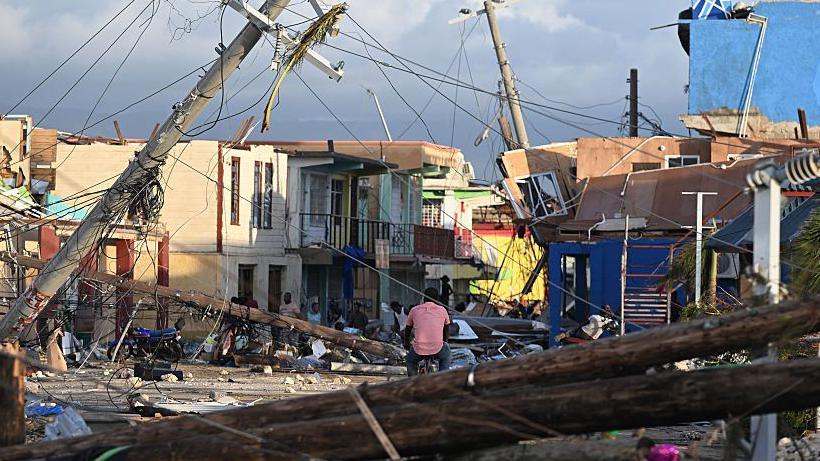
As I write this post hurricane Melissa has intensified from a category 1 to a category 5 in just about 24 hours, a rapid growth that had never been seen in any storm before the advent of global warming. Right now as I write this the storm is taking at direct aim at the island nation of Jamaica and all of the news programs are discussing the effect Melissa could have on the lives of people in its path.
Hurricane Melissa did a tremendous amount of damage to Jamaca. Are we simply going to adapt to these extreme weather events, like the animals in this blog have to, or are we going to do something about climate change? (Credit: BBC)
The harm that climate change is doing to our species is real and growing but what about the effects that it is having on the other creatures that live here on planet Earth? In this post I’ll be discussing the way that three different species of animal are adapting to global warming and it’s not always bad news, at least not for them. I’ll start with the most northerly species and work my way south.
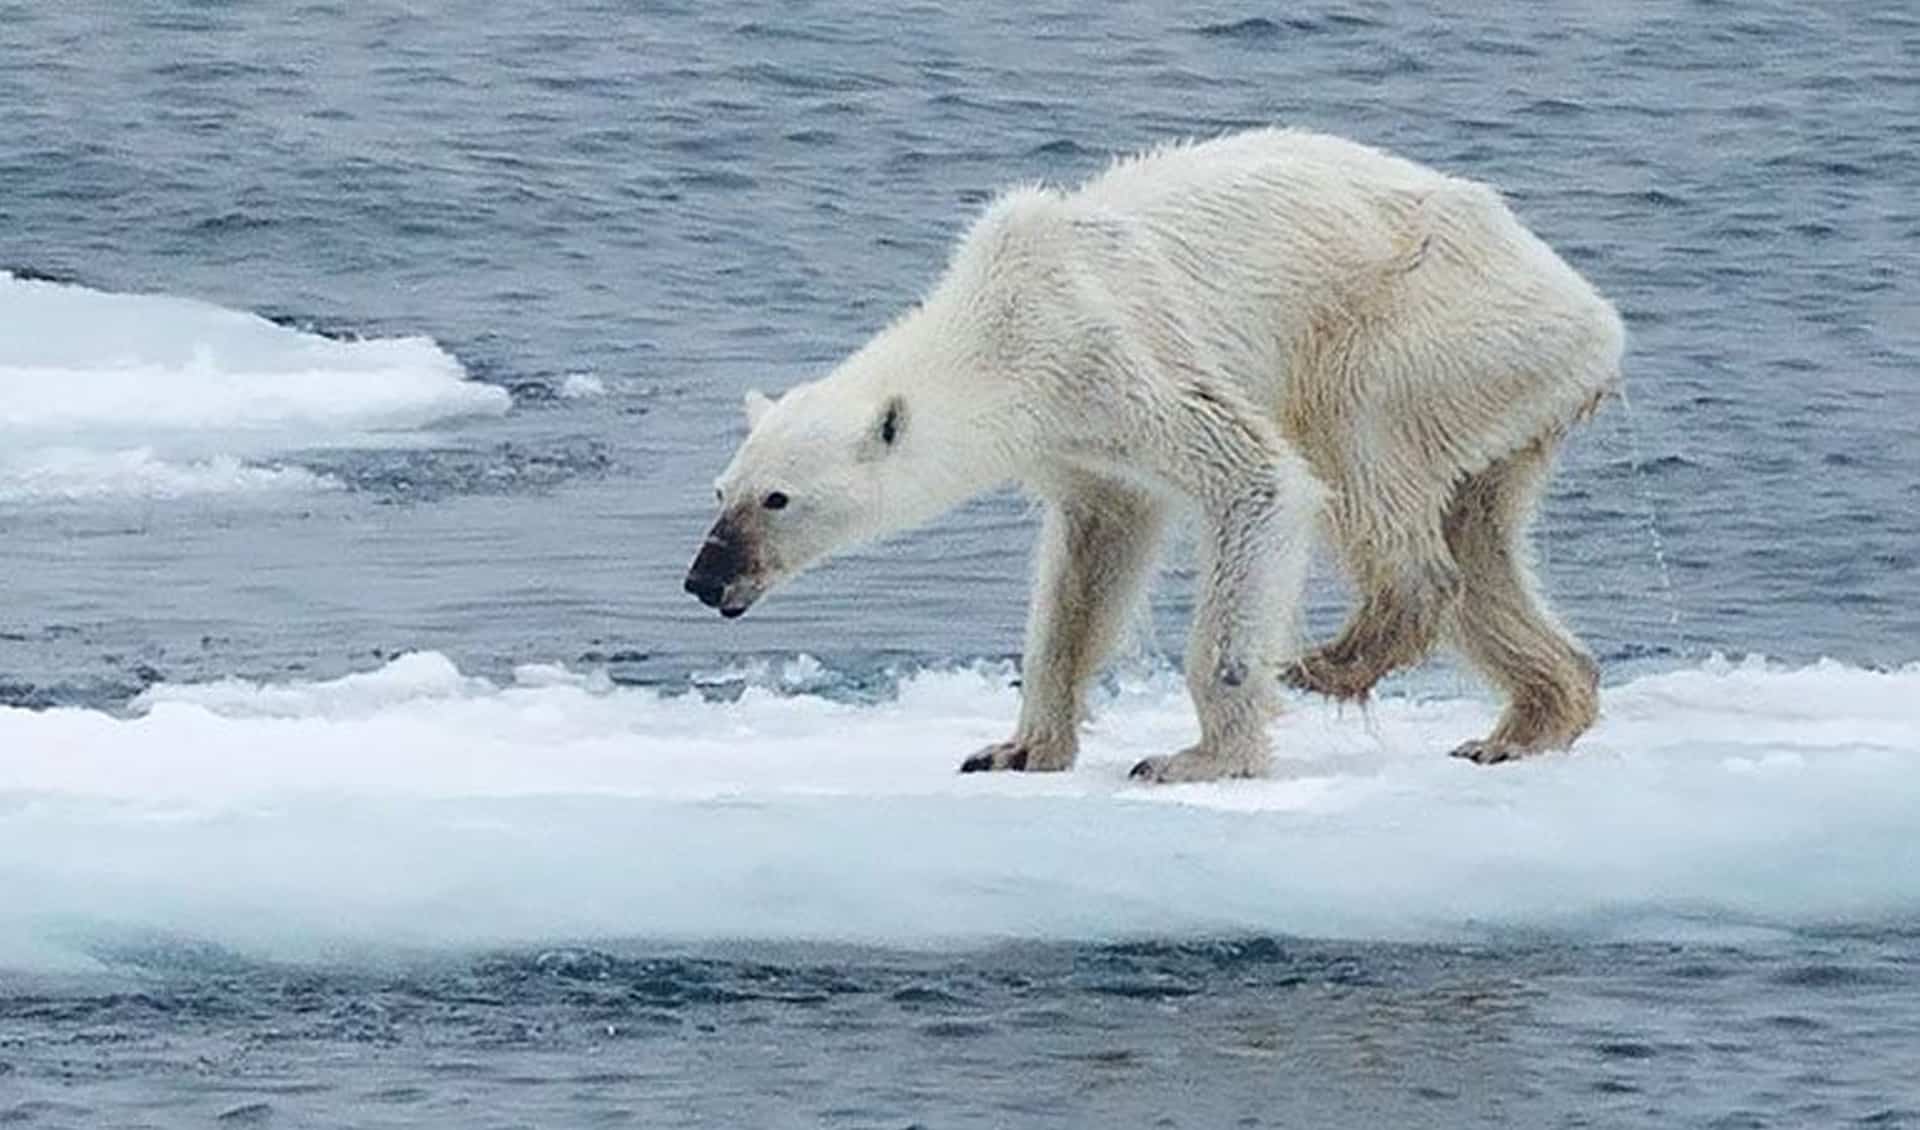
Perhaps the best known species being driven to the edge by climate change is the Polar Bear. As more and more sea ice melts the hunting grounds for the polar bear are disappearing and maybe with it, the bear itself! (Credit: Earth.org)
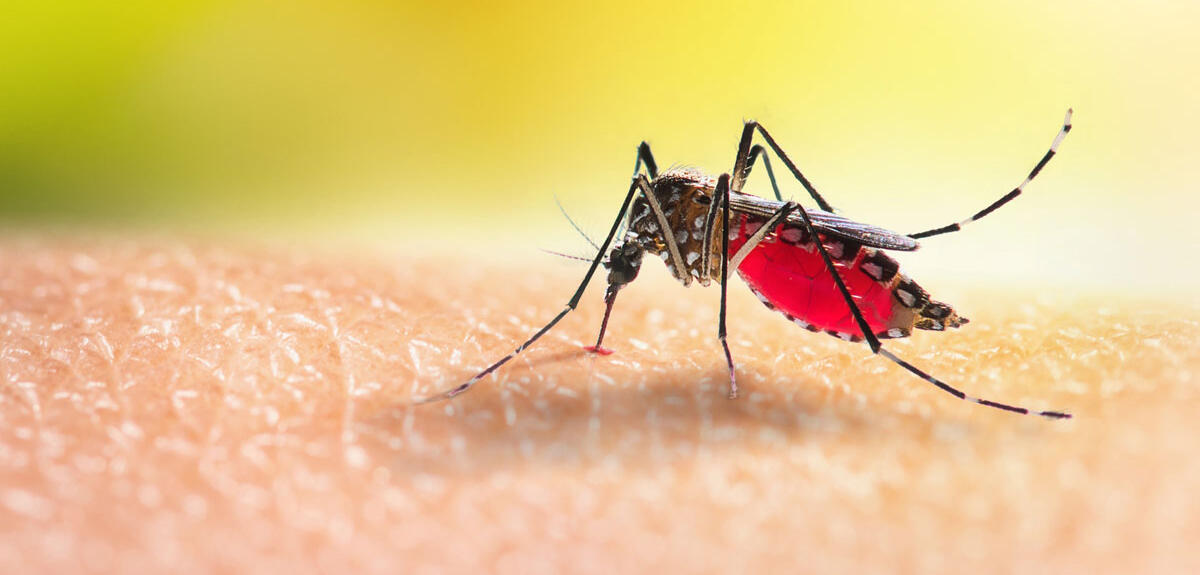
The island of Iceland is one of the very few places on Earth that are considered to be completely free of the insect pests mosquitoes, the other being Antarctica. Obviously both places are very cold but Iceland is also rather isolated and because of the nearby Gulf Stream, Iceland can have several periods of Ice-Thaw every year. That makes it difficult for any species of insect to both get to the island and to survive there for very long. Now, mosquitoes have been detected several times at the airport for Iceland’s capitol Reykjavik, stowaways on jets coming from other countries. Those invaders have never survived for long however, until now.
It’s thought that diseases spread by mosquitoes have killed as much as half of all the human beings who have ever died! (Credit: CRNS News)
Amateur naturalist Bjorn Hjaltason, who lives in Kjós, a glacial valley to the southwest of the capital, commonly hangs wine soaked ropes outside of his home in order to capture and study Iceland’s moths. Just a few weeks ago Mr. Hjaltason noticed three flies on his ropes of a type that he had never seen before. Mr. Hjaltason sent his finds to the Iceland Institute of Natural History where the flies were identified as two females and one male of the mosquito species Culiseta annulata, a common pest in Europe and one of the most cold-resistant species of mosquito.
Bjorn Hjaltason with his wine soaked traps for catching insects in Iceland. An amateur naturalist Bjorn recently discovered the first evidence for mosquitoes living in Iceland, another development caused by climate change. (Credit: ZME Science)
There’s no doubt as to why mosquitoes have suddenly been able to survive in Iceland, over the last twenty years the average temperature on the island has increased by more than one degree Celsius, that’s one degree over the entire year for the entire island. Just this past May Iceland recorded its highest ever temperature, 26.6ºC and the temperature remained above 20 degrees for ten consecutive days, another record. Just more evidence that, as the world’s temperatures warm species that we think of as tropical or temperate are moving northward.
Known as the land of fire and ice, Iceland is rapidly losing its glaciers thanks to global warming. The picture on the left is from 2003 while the one on the right is from 2013, the change is significant in only ten years. (Credit: Iceland Monitor -mbl.is)
The cold waters around Great Britain have been fished for thousands of years. A large part of the food eaten by the citizens of the UK today still consists of plaice, turbot and Dover sole harvested from the English Channel and the North Sea. Recently however fisherman along the English coast have been bringing up an unexpected catch, hundreds or thousands of octopodes, the correct plural for octopus.
Fisherman in England are profiting from the octopodes who are moving into English waters. Those who make their living off of crabs and lobsters are not at all happy about the new arrivals however. (Credit: SKY News)
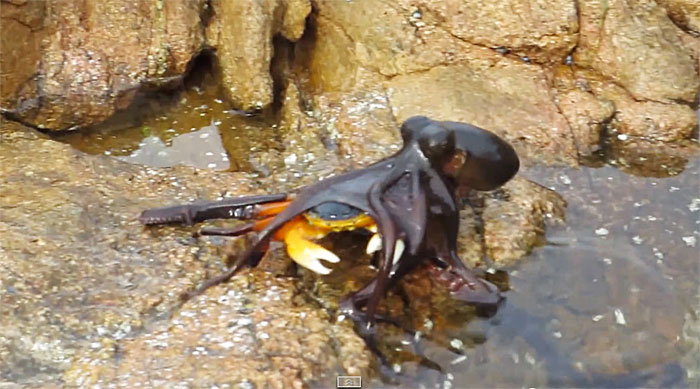
The octopodes are members of a species normally found in the warmer waters of the Mediterranean but once again thanks to global warming the temperature of the waters of the channel have risen and so the cephalopods are moving north. The fishermen along England’s south coast are thrilled because octopus sells for around seven pounds a kilo, a good deal more than their usual catch. Lobstermen and crabbers are not so thrilled however because the octopus feed on their catch, and octopodes are both clever and voracious eaters.
Even out of water an octopus is very skilled at hunting crabs and lobsters. No wonder the lobstermen in England are not thrilled about their increasing numbers. (Credit: California Diver Magazine)
Another such example is happening in the waters of Chesapeake Bay where Stone Crabs have been captured for the first time ever. Native to the warmer waters of Florida and the Gulf of Mexico Stone Crabs have never before been observed north of the Carolinas. Four males of the species were discovered near Norfolk, Virginia over this past summer however.
The big claws of Stone crabs are delicious but the rest of the animal not so much. So sometimes crabbers in gulf states just break off the claws and throw the crabs back into the water. If, that’s a big if, the crab survives it will regrow its claws. (Credit: Port Royal Sound Foundation)
Labouratory tests have shown that Stone Crabs do not survive in waters with a temperature below 5ºC and do not survive well below 10ºC. The waters of Chesapeake Bay have also been warming by more than 1ºC since the 1980s and that appears to be enough to allow Stone crabs to extend their habitat northward into the Bay.
The Chesapeake Bay however is famous for its Blue Crabs, of which you can eat almost the whole thing, which I have done many times! (Credit: Sandaway Suites and Beach)
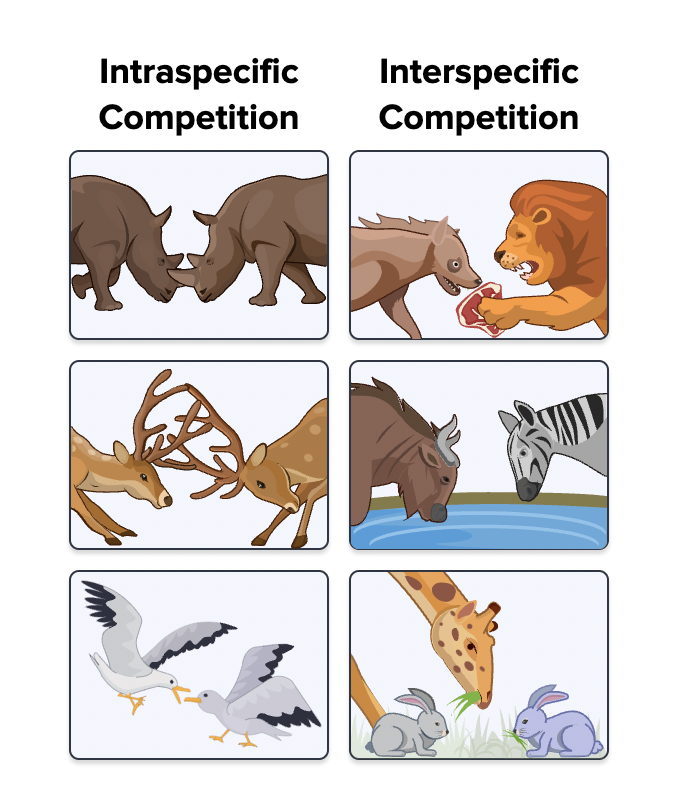
Now this could be a small silver lining in the dark cloud of climate change because Stone Crab claws are delicious and the species will not compete with the Chesapeake’s famous Blue Crabs. So in the future the bay’s crabbers may find themselves with a new source of income.
In nature competition is the rule whether it be within a species or between species. Stone crabs and Blue Crabs should not compete however. (Credit: CK-12)
Finally my last story about how climate change is causing species to move northward is about a single individual, a single animal who would not exist except for climate change.
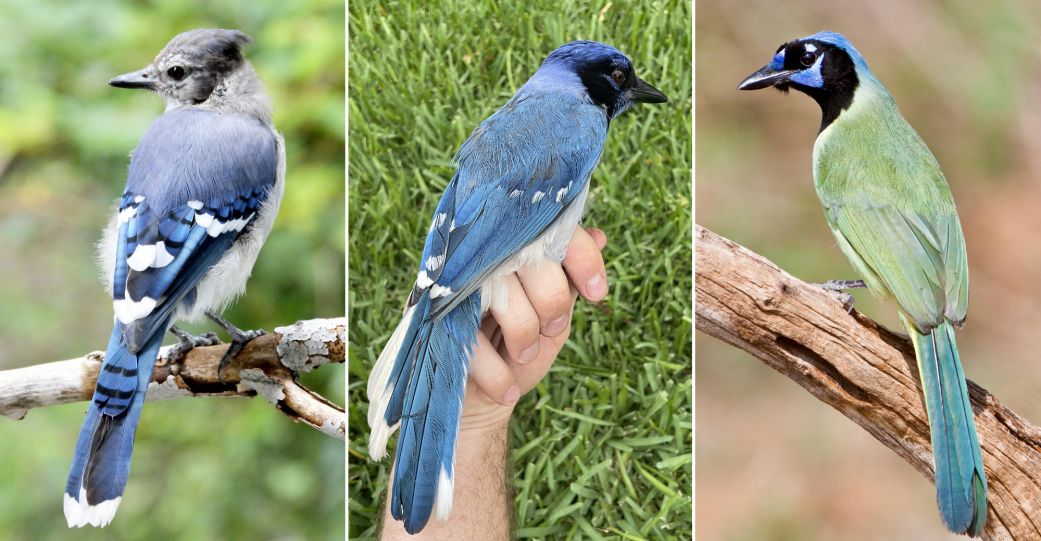
Blue jays are one of the most common songbirds in the eastern US and Canada. Not only are blue jays colourful but they are also fearless, often getting into fights with other birds many times their size, sometimes even with human beings. At the same time Mexico and Central America have their own species of jay, the closely related green jay.
The familiar Blur Jay is on the left while the Mexican Green Jay is on the right. In the middle is a Hybrid Jay with a Blue father and a Green Mother. (Credit: CNN)
Now green jays are a tropical species who have rarely been seen north of the Rio Grande while blue jays are a temperate species rarely seen west of Houston, Texas. Thanks to climate change however the two species, separated by an estimated seven million years of evolution, are now intermingling in southern Texas. And when two closely related species share the same habitat the result can be, a hybrid.
Yes, Lions and Tiger can interbreed as can many other closely related species, a mule is the best known example. (Credit: Live Science)
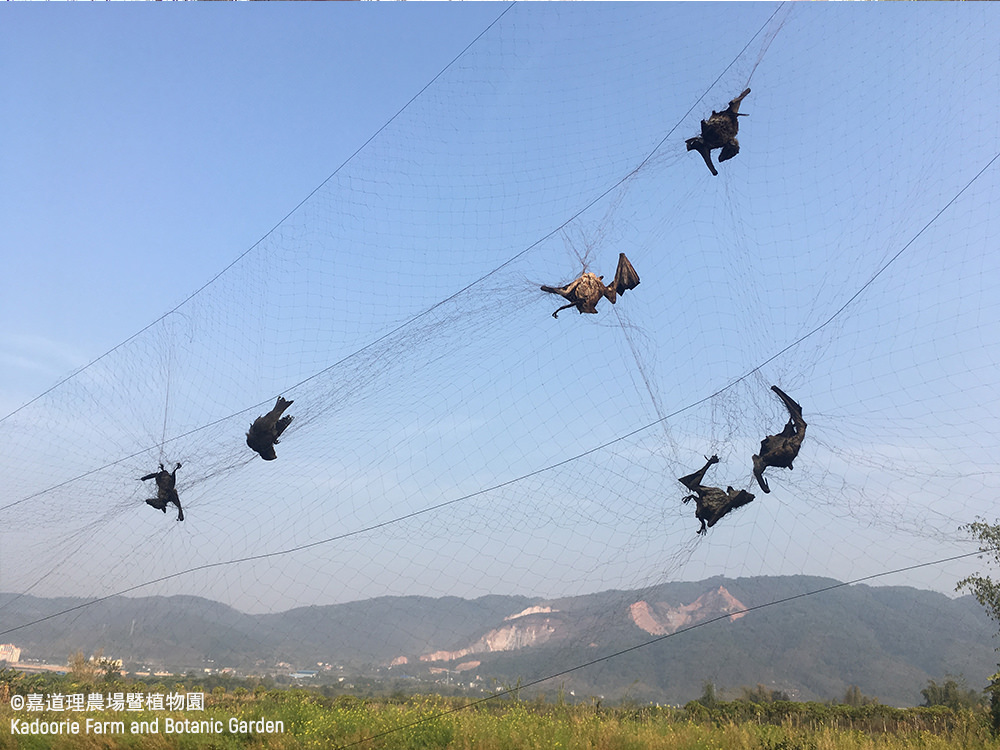
A birder living in a suburb of San Antonio recently posted a photograph of an odd looking bird on the social media app eBird. The photo was noticed by Brian Stokes, a Ph.D. candidate at the University of Texas at Austin. Stokes contacted the woman and arranged to come to her home to observe, and hopefully catch the animal. Using a mist net, a common technique ornithologists use to capture small birds unharmed, Stokes managed to capture the bird and get a blood sample before banding and releasing it.
Naturalists studying birds species will often catch their specimens in mist nets. The birds are rarely harmed and are usually released after being examined and banded. (Credit: Kadoorie Farm and Botanic Garden)
DNA testing of the blood sample showed that the bird was a hybrid of a male blue jay and a female green jay, an animal that would not have existed without climate change. How many more such hybrids will be born because of global warming remains to be seen.
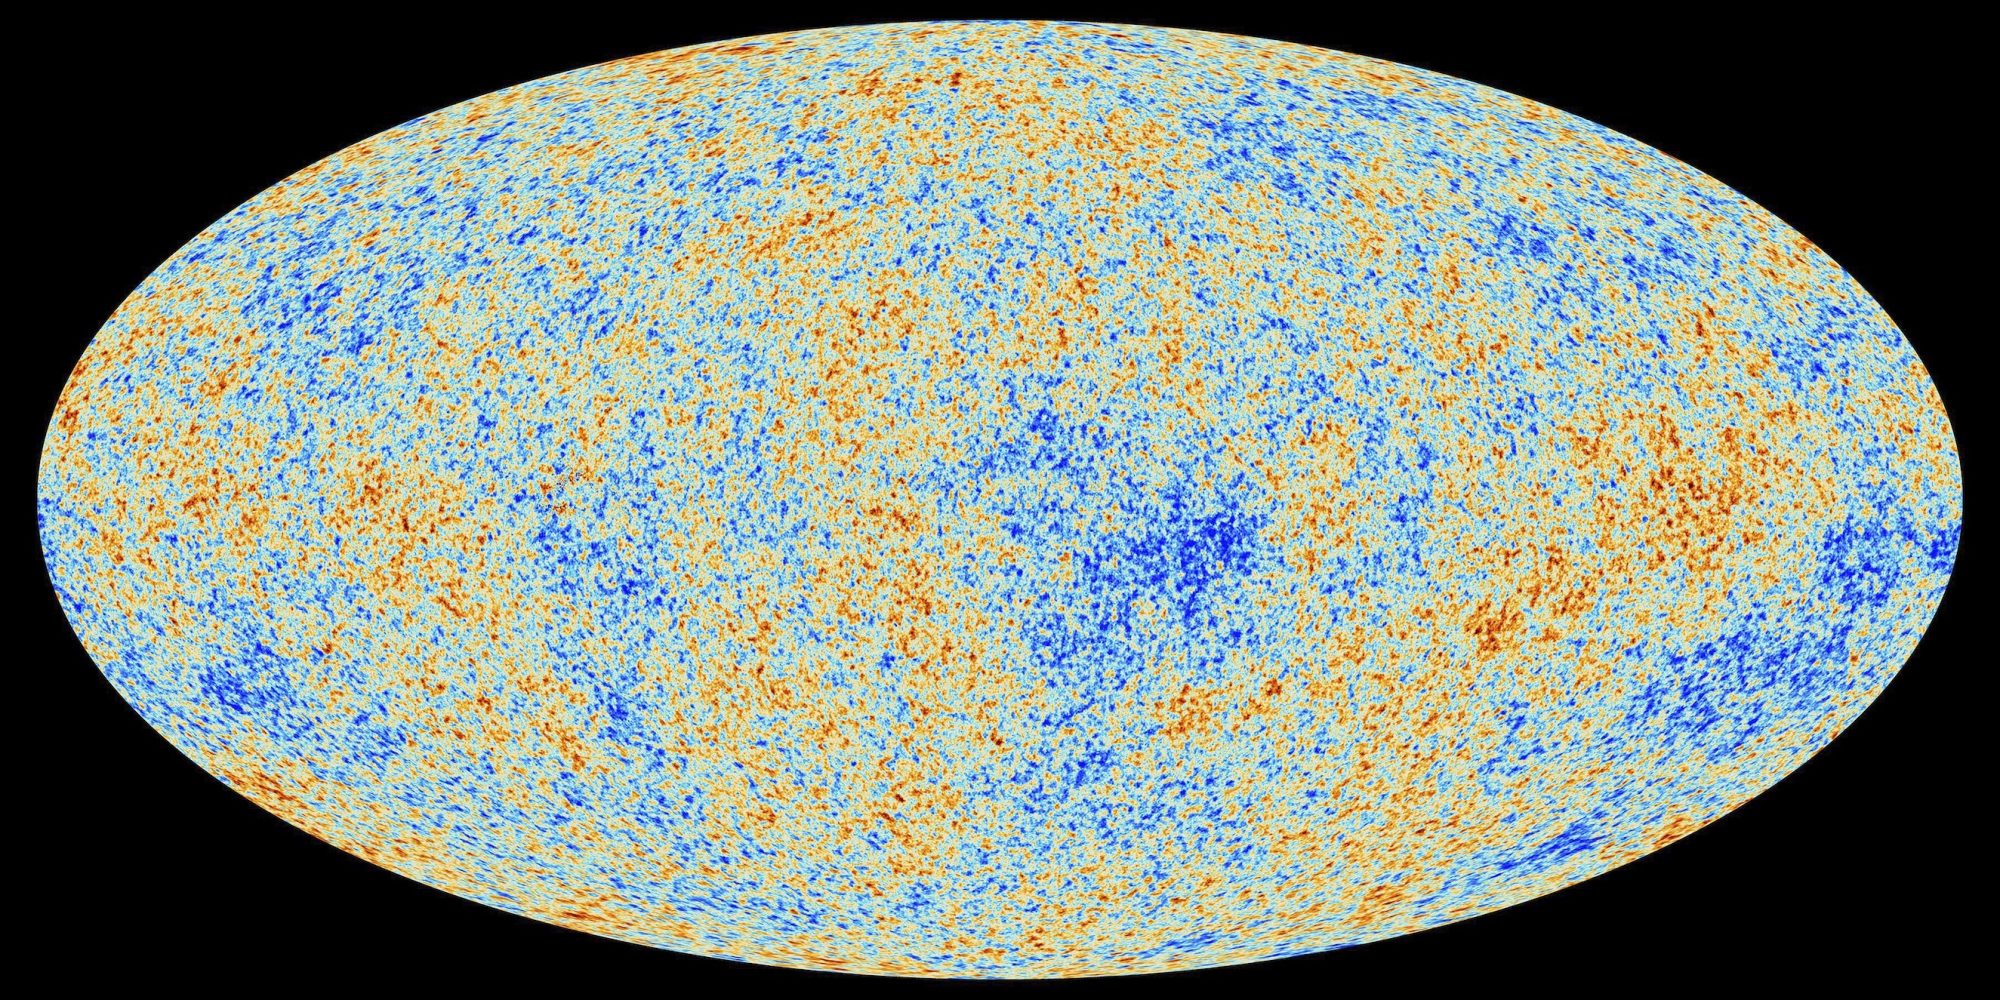
I’ll begin today’s post by reviewing out current model of the Universe. About 13.5 Billion years ago our Universe underwent a ‘Big Bang’, an explosion of unimaginable energy and pressure. This explosion caused the entire Universe to expand rapidly as time passed but also caused it to cool until atoms could form. We can still see the ‘fossil’ evidence of this time in the Cosmic Microwave Background (CMB).
The Cosmic Microwave Background (CMB) as seen by the Planck Satellite. This is the ‘fossil’ light left over from about 370,000 years after the Big Bang. (Credit: Wikipedia)
After about 500 million or so years gravity caused the gasses of the early Universe to begin to clump together, forming the first stars and galaxies. Gravity also should have made the general expansion of the Universe slow down but something that we call ‘Dark Energy’ is actually making the expansion accelerate. Discovered in the 1990s we still know very little about dark energy even after almost 30 years of intense study.
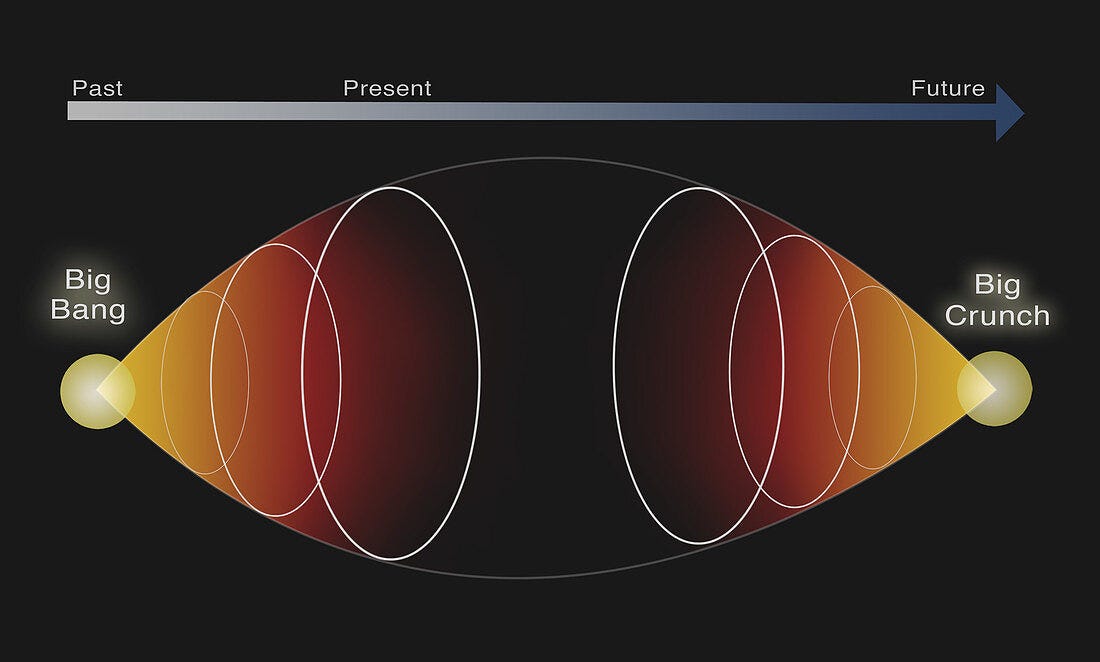
Back in the 1990s astronomers all thought that the ultimate fate of our Universe would be one of the three scenarios on the left. Either gravity would cause the expansion to stop and then begin a contraction phase leading to a ‘Big Crunch’, far left. Or gravity was too weak to stop the expansion and the Universe would expand forever, third from left. The second from the left is a scenario where gravity and the expansion are exactly balanced. When astronomers tried to decide which scenario was correct they found that the expansion was actually increasing, far right. We still have little knowledge of what is causing the acceleration, so we call it ‘Dark Energy’. (Credit: LSST.org)
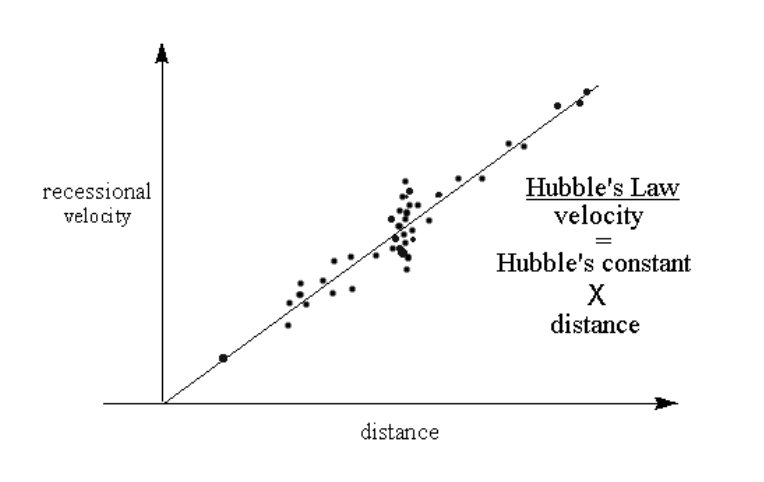
I’m going to have to get a little technical here about how astronomers actually measure whether the Universe’s expansion is decelerating or accelerating. The whole idea of the Big Bang began when Cark Hubble first found that, except for a few really close galaxies, the light from all of the galaxies was red shifted, meaning that they were moving away from our galaxy. At the same time he discovered that the further away a galaxy was the faster it was receding. Hubble expressed this as a simple equation.
V=HoD
Some of Hubble’s actual data for his ‘Law’ about the expansion of the Universe. (Credit: Curious STEM)
Here D is the distance to a galaxy, V is the velocity that galaxy is moving away from us and Ho is a constant called Hubble’s constant. Now astronomers realized that if gravity were slowing the expansion of the Universe, then Ho would not be a constant but rather be getting smaller as the Universe aged.
Before Newton’s law of gravity people thought that gravity only affected things here on Earth, that the heavens obeyed different rules. It was Newton who realized that gravity is everywhere and affects everything, even the expansion of the Universe. (Credit: BBC)
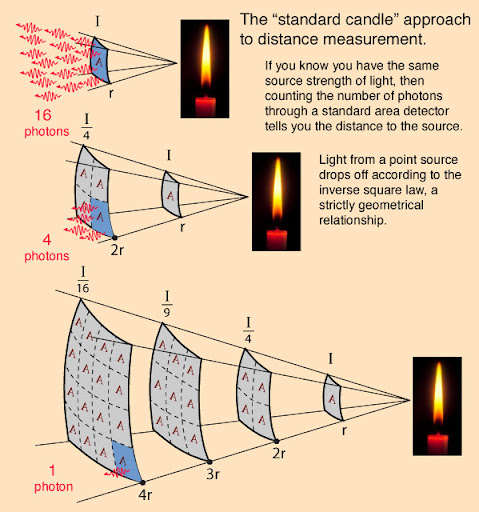
It wasn’t until the 1990s that astronomers developed a technique to measure any change in Ho. Astrophysicists studying Type 1a supernova calculated that all such supernova should explode with the same amount of energy, should shine with the same absolute brightness. So if a Type 1a supernova appeared bright that meant the galaxy it was in was fairly close to our Milky Way while if the Type 1a supernova appeared dim it meant that the host galaxy was farther away. Astronomers call such objects ‘Standard Candles’ and can use them to measure the distance to objects in the Universe.
Astronomers are always searching for what they call ‘Standard Candles’ that is sources of light far away in space whose absolute brightness they know somehow and whose apparent brightness they can measure. A simple calculation will then tell them just how far away that candle is! (Credit: hyperphysics.phy-astr.gsu.edu)
So using Type 1a supernova to measure the distance, and then using redshift to measure velocities they could determine whether Ho was getting smaller. What they found was that Ho was actually getting bigger, that something was pushing the Universe to expand faster, something they called ‘Dark Energy’.
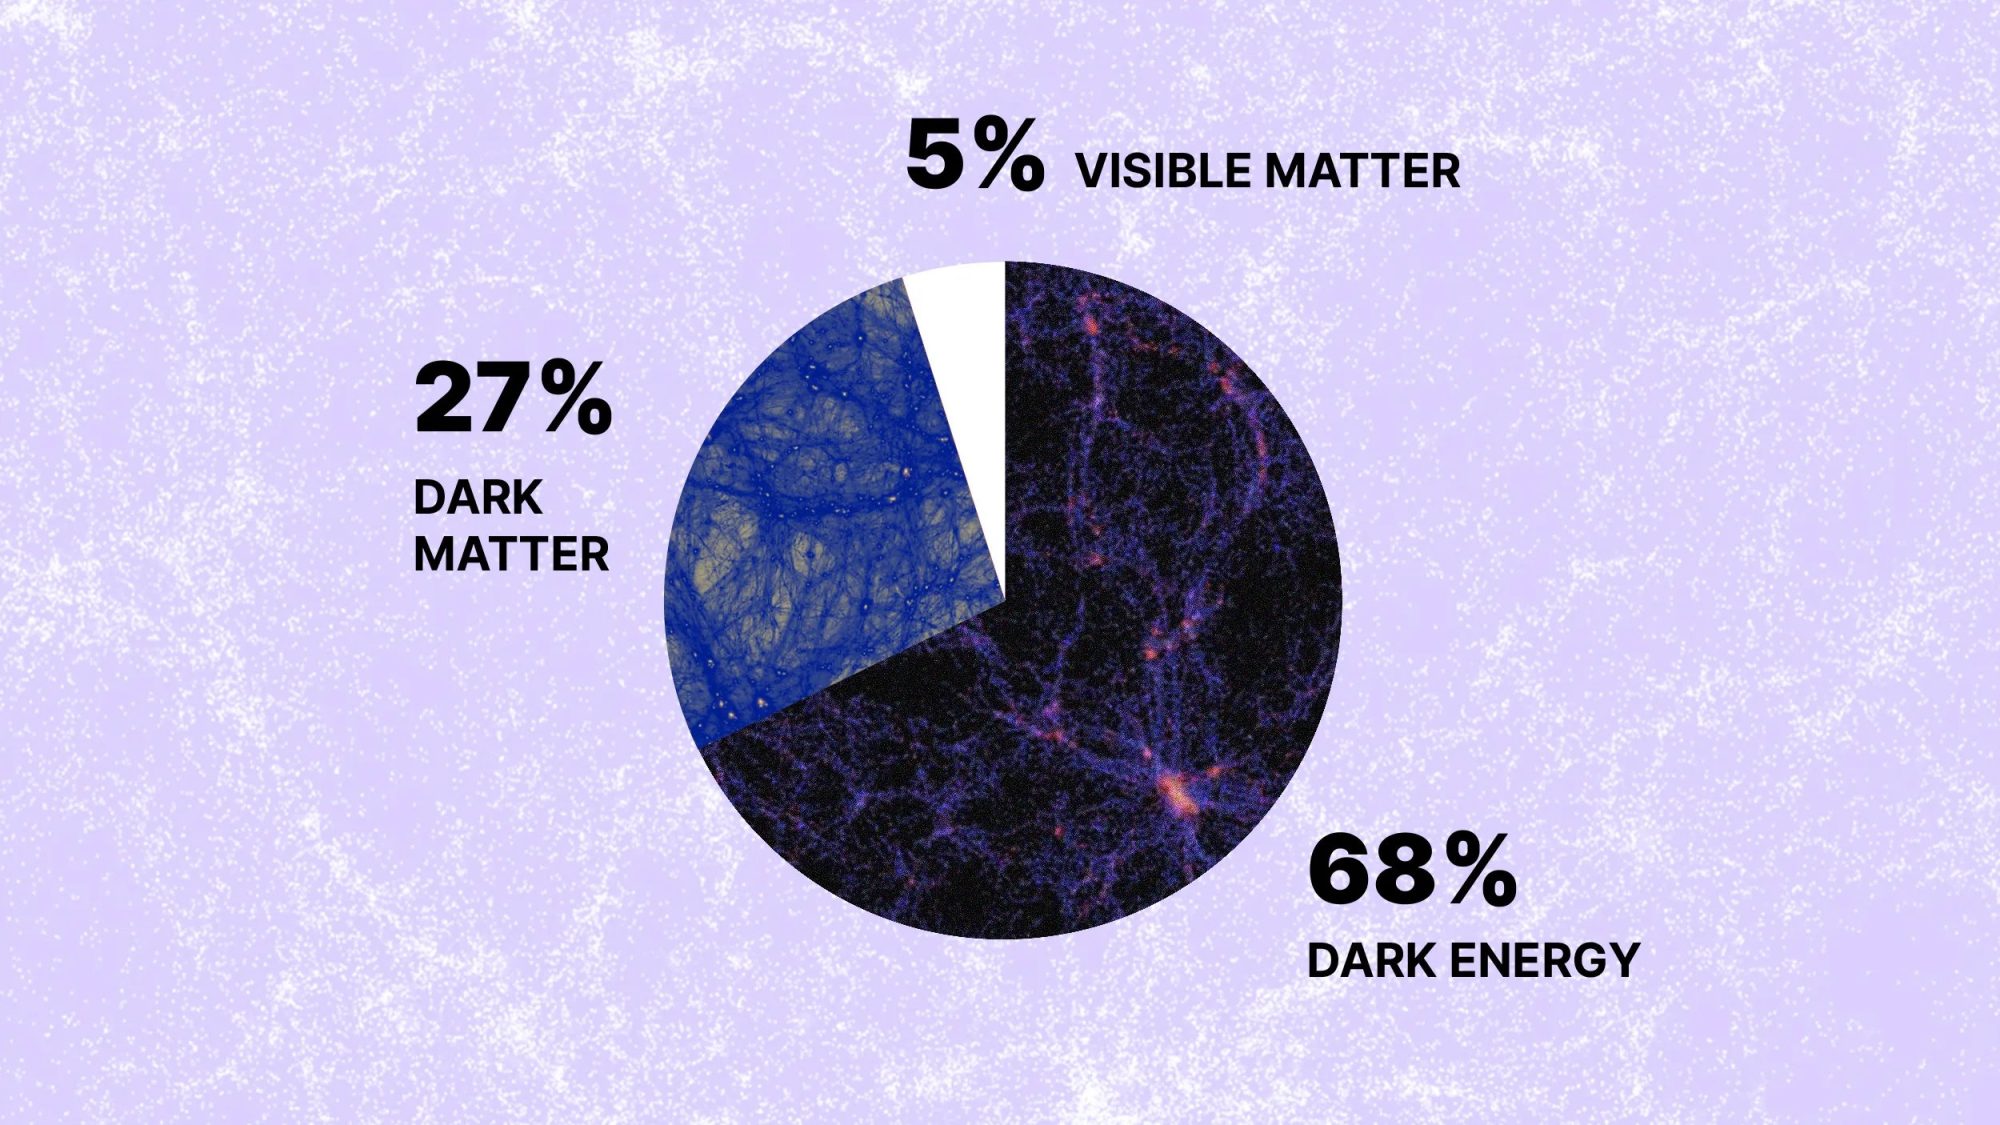
Astronomers calculate that about two-thirds of all the energy in the entire Universe is ‘Dark Energy’ about which we know almost nothing! (Credit: Big Think)
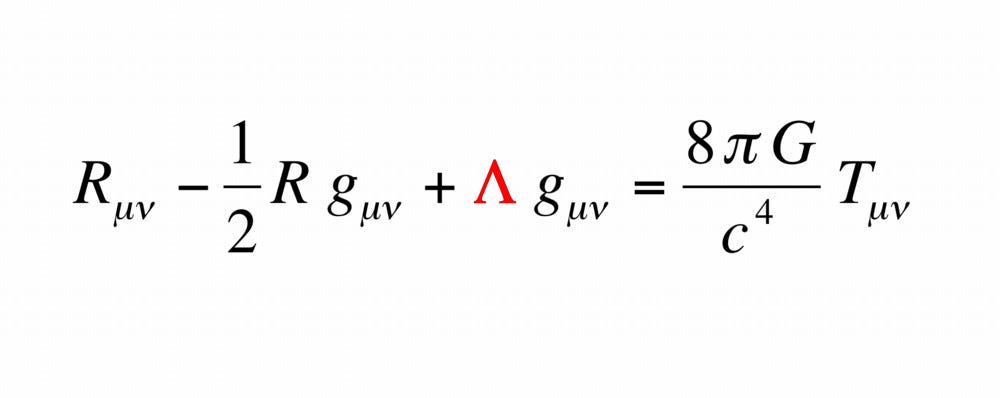
As I said earlier the standard model of the Universe considers Dark Energy to be the Cosmological Constant that made Einstein’s field equations complete, a property of space itself. Still cosmologists wanted to be sure and so they continued to gather supernova data in order to see if Dark energy did remain constant with time.
The full, tensor version of Einstein’s field equations for gravity. Mathematically the constant lambda has every right to appear, but its value had to be very small or it would be seen in the way the planets orbit our Sun. Einstein was glad to get rid of it but it would generate something like ‘Dark Energy’ so now its come back. The question is, is lambda really constant? (Credit: Medium)
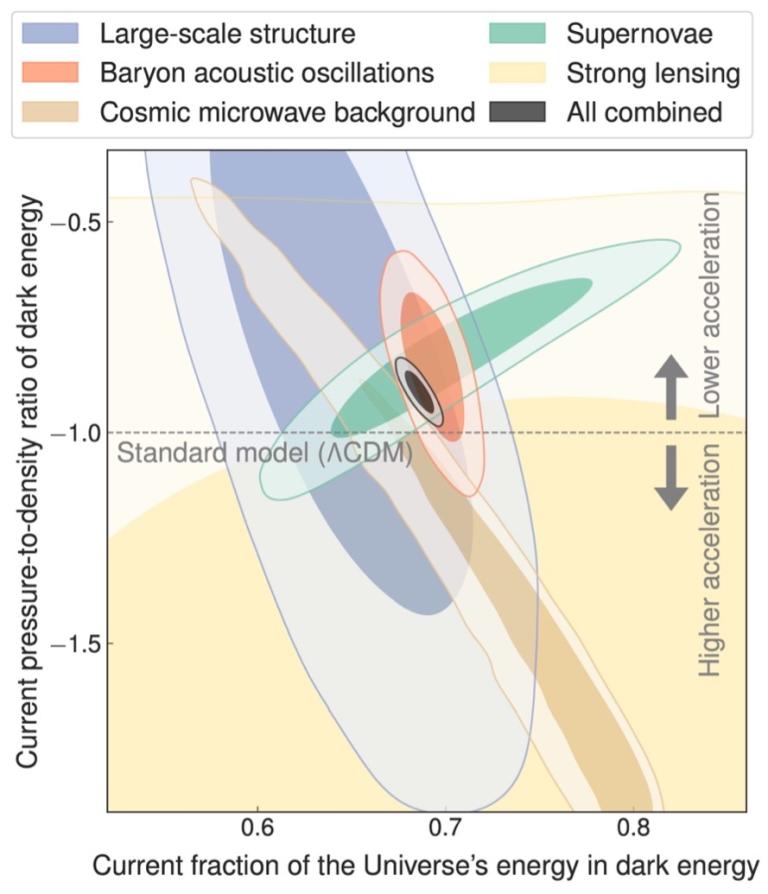
In several of my past posts I have discussed recent evidence that Dark Energy is in fact dynamic, that it does change with time and that it has been growing steadily weaker as the Universe ages. Now a new paper published in the Monthly Notices of the Royal Astronomical Society by astrophysicists at the Department of Astronomy and Center for Galaxy Evolution Research at Yonsei University in Seoul, South Korea asserts that the technique used to measure Dark Energy needs a correction factor. When that correction is carried out it makes λ much weaker and in fact in just the last billion years or so the Universe has actually begun to decelerate.
Over the last 20+ years astronomers have tried to study Dark Energy by many different techniques. A consensus is growing that Dark Energy is not constant but rather dynamic, changing with time and growing weaker! (Credit: UChicago News – University of Chicago)
What the researchers assert is that the brightness of a Type 1a supernova depends on the age of the white dwarf star that explodes. Taking this correction factor into account the supernova data becomes far more conclusive that dark energy is weakening and in fact agrees more closely with data based on analysis of the CMB. It also means that sometime in the last billion years dark energy became weaker than gravity and the Universe has in fact begun to decelerate.
If Dark Energy is growing weaker, we may be headed toward a ‘Big Crunch’ where the entire Universe collapses into a singularity triggering another ‘Big Bang’. (Credit: Avi Loeb – Medium)
Now there are already criticisms of the paper, the researchers did not in fact measure the age of the star that goes nova, a rather impossible thing to do with all the billions of stars in other galaxies. Instead they measured the age of the galaxy and used that value as a proxy for the age of the star that went nova. Still the author’s new measurements of the change in dark energy do closely align with the analysis made from the CMB data.
Guessing someone’s age at a party may be fun but guessing the age of a star in a distant galaxy is a lot of hard work. (Credit: Amazon.com)
The eventual fate of the Universe itself depends on the nature of Dark Energy and cosmologists and astrophysicists are working hard to uncover its secrets.
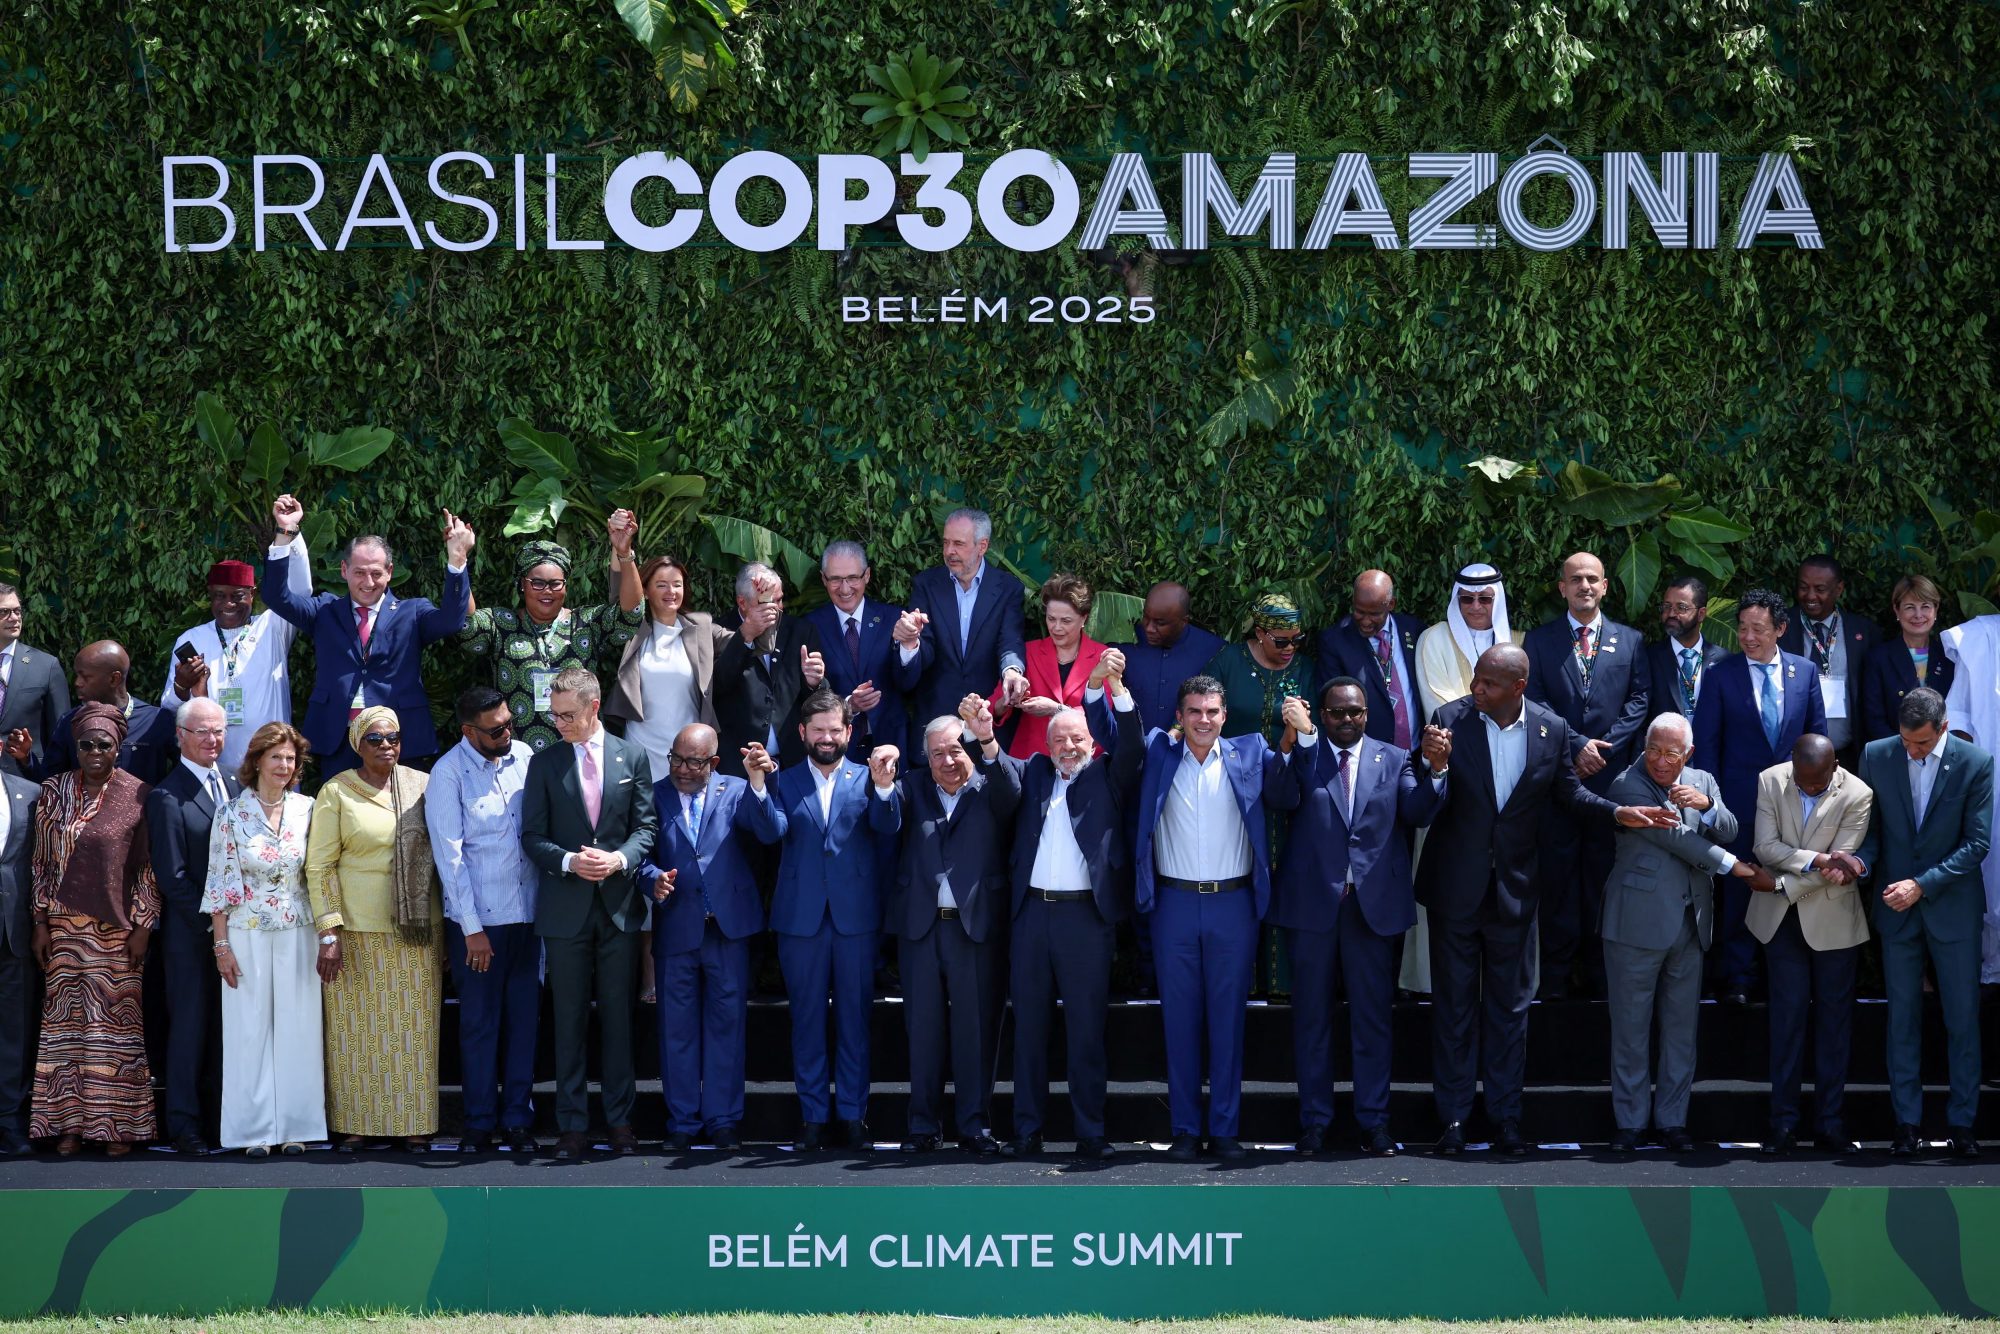
The United Nations sponsored international Conference of Parties (COP) for dealing with Climate Change has wrapped up its annual meeting (COP30) in Belem, Brazil and so it’s time to review what has, or has not been accomplished at this years meeting. To be short, not much.
It was all smiles as the international Conference of Parties (COP30) got underway in Brazil. Trouble was none of the important world leaders bothered to attend and the conference soon broke down into special interests. (Credit: Reuters)
Brazil’s President and host for the summit, Lula da Silva had hoped to focus the meeting on his efforts to preserve the tropical rainforests. These vast forests like the Amazon are vital in our fight to reduce greenhouse gasses in the atmosphere thanks to their ability to absorb and store CO2. That was the rationale behind the choice of Belem as host city, because of its position at the mouth of the Amazon. Problem was that Belem was too small and remote a city for such a large gathering, over 50,000 attendees. In addition to the carbon footprint of everybody traveling to Belem there weren’t enough hotel rooms for all the delegates leading many to stay aboard palatial yachts brought to Belem harbour for just that purpose.
Situated at the very mouth of the Amazon River, the choice of Belem as the host city was symbolic of the need to preserve our natural resources. Problem was the city wasn’t prepared for such an influx of visitors. (Credit: Brol.com)
But the problems of who attended the conference were outweighed by who didn’t attend. The heads of state of China, India and Russia refused to attend but at least sent delegations. The United States on the other hand, under orders from Trump sent no official delegation at all. To have the heads of state of the four biggest greenhouse gas emitting countries not attend a conference on climate change pretty much dooms the whole affair right at the start.
Historically the US has emitted more greenhouse gasses than any country and we’re still currently in second place, but the ‘Stable Genius’ here thinks climate change is just a big hoax! (Credit: YouTube)
Still the world leaders who did show up, headed by the UK’s Keir Starmer, France’s Emmanuel Macron, Germany’s Friedrich Merz, along with host da Silva, tried their best to salvage some results from the conference. The biggest issue to be dealt with was an attempt to develop a ‘roadmap’ for the future elimination of fossil fuels as a power source. At the conference over 80 countries, led by Colombia, pushed hard for the adoption of such a timetable where each country would announce how they intend to de-carbonize their economies. Even a few oil producing nations, like Mexico and Brazil supported the idea of a roadmap.
Here’s the real reason why Trump insists climate change is a hoax, the US just makes too much money from fossil fuels. After all money is no hoax! (Credit: Voronoi)
Since global fossil fuel use is the greatest contributor to greenhouse gasses eliminating coal, oil and natural gas as fuels is the surest, quickest way to reduce the amount of greenhouse gasses in the atmosphere. However, the big fossil fuel producing countries fought tooth and nails against the very idea of such a roadmap. In fact countries like Saudi Arabia, Russia and Venezuela still are fighting against any official recognition of the fact that fossil fuels generate greenhouse gasses.
How can anybody look at something like this and not think we’re changing the world somehow? There are thousands upon thousands of such industrial plants around the world and little by little we are just turning mother nature into a garbage dump! (Credit: Live Science)
That’s true, the official communiqué agreed to at the end of COP30 called for the reduction of greenhouse gasses without explicitly mentioning fossil fuels. Without a roadmap however, without even facing the fact that fossil fuels are the driving cause of global warming there is little hope of any real progress being made in ending climate change. Countries with growing economies like China and India will simply do whatever serves their own interest, even if that means building more coal burning power plants.
The nation of India is determined to grow their economy even if it means turning their capital New Delhi into the world’s most polluted city! (Credit: Brookings Institute)
There was little progress on another front as well, that being financial aid for small countries that are already feeling the effects of climate change. These small countries are collectively responsible for only a tiny fraction of the greenhouse gasses in the atmosphere but many are already suffering greatly from global warming.
The tiny island nation of Vanuatu has never emitted much in the way of greenhouse gasses but thanks to rising sea levels induced by global warming it is threatened with complete destruction by climate change. (Credit: Britannica)
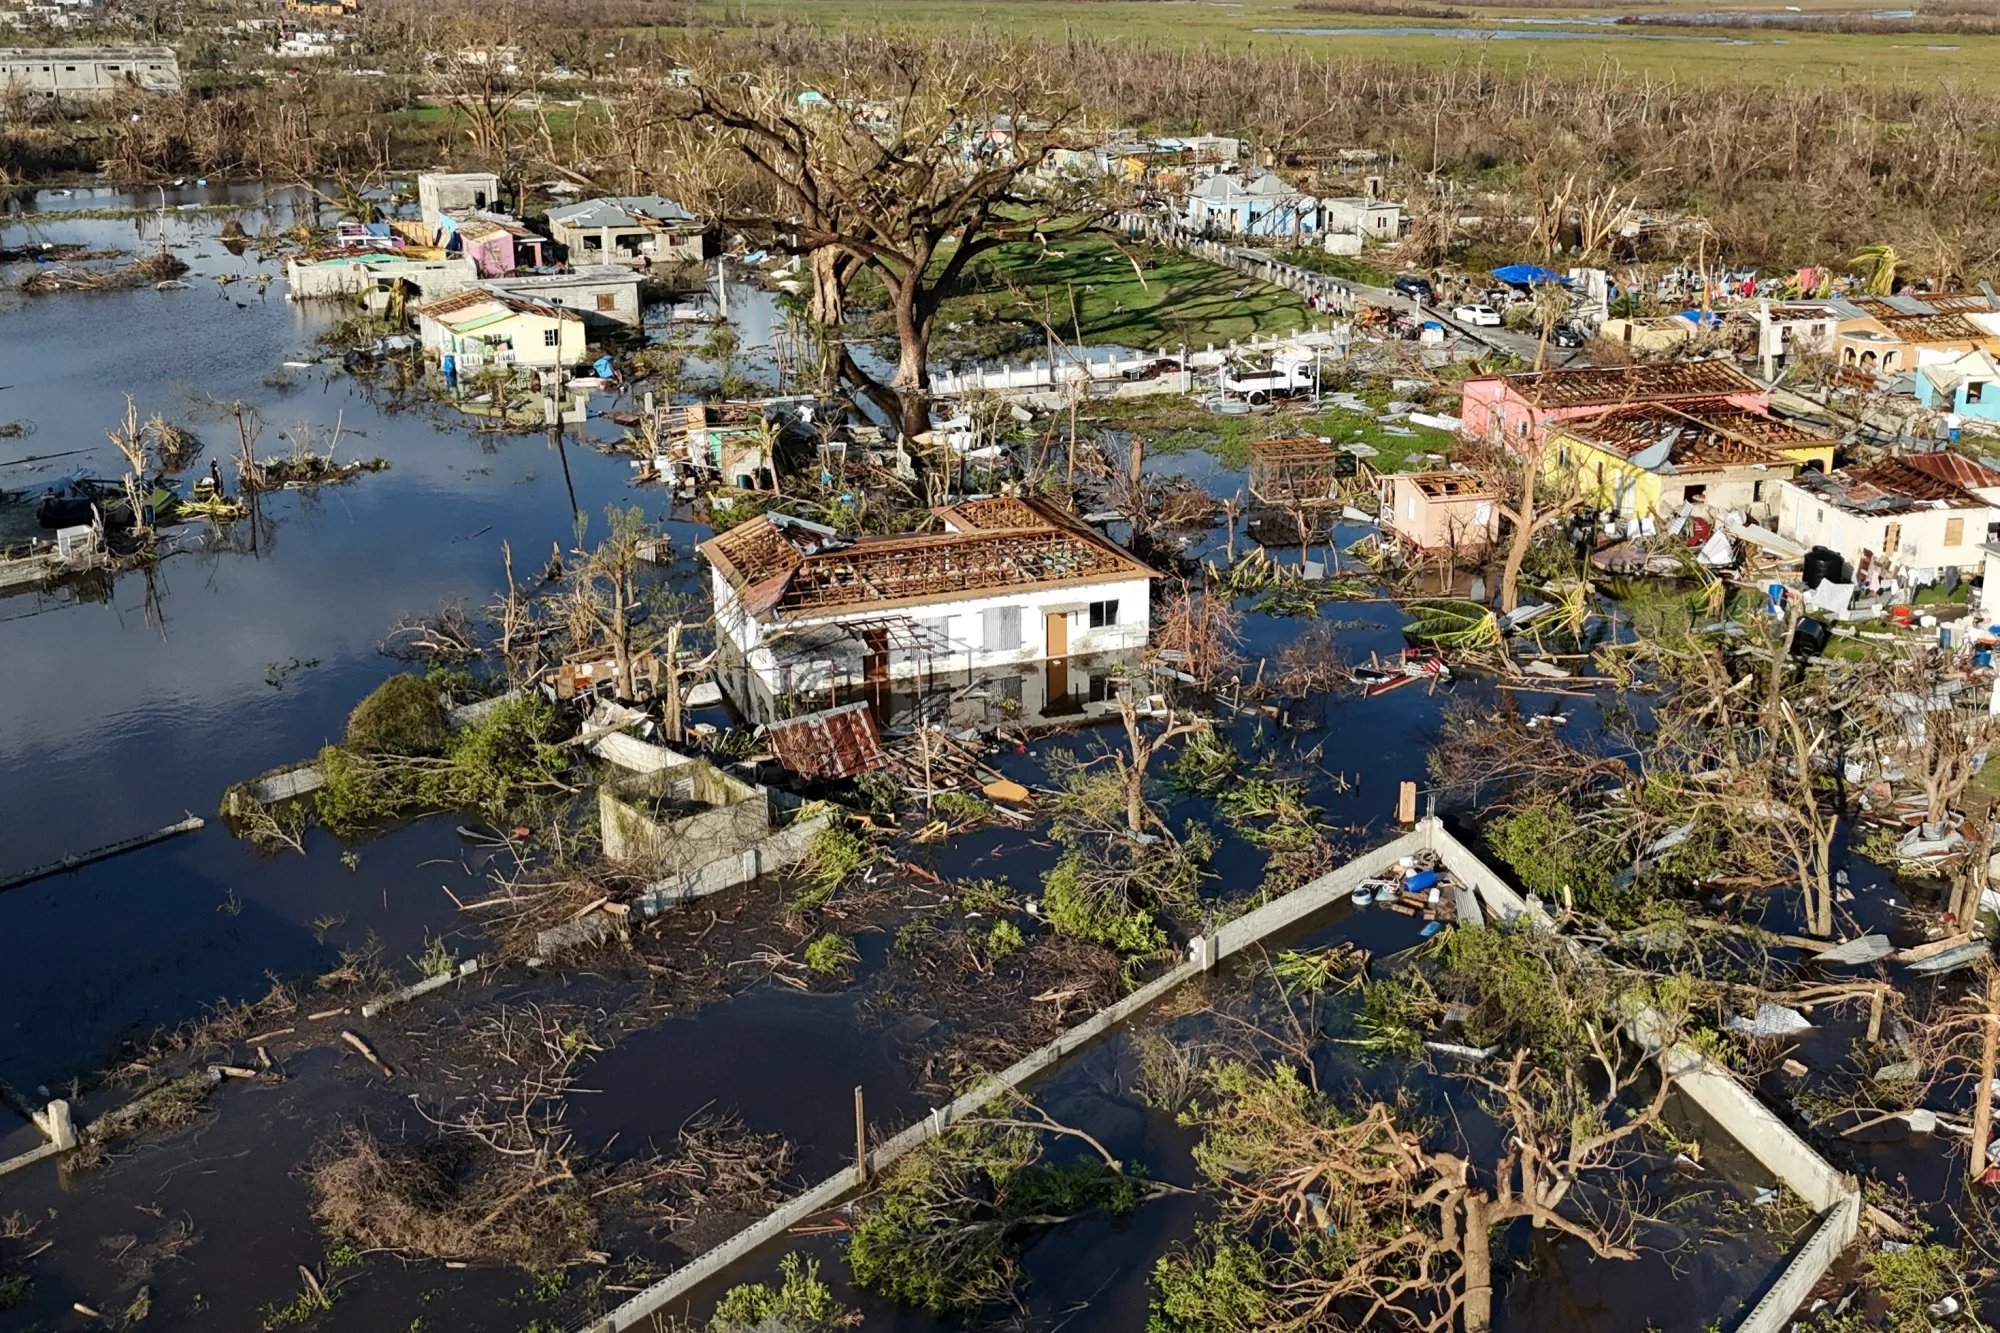
Consider Ethiopia, never an economic powerhouse, over the last hundred years the country has emitted maybe one percent as much greenhouse gas as the US does in one year. Yet Ethiopia has been dealing with both increased heat and drought conditions brought on by global warming. Or think of Jamaica, which has just been hit by the most powerful hurricane in the island’s recorded history. A recent paper has estimated that Hurricane Melissa’s winds were increased by 16% because of global warming. How much of Jamaica’s damage, how many lives were lost due to climate change? Should the richer countries of the world, countries that have emitted by far the most greenhouse gasses, compensate the smaller countries for the damage caused by climate change.
Can you say Fox News? Sure you can! Let’s face it this is the way the world usually works and unfortunately, it’s probably the way we’re going to deal with climate change. (Credit: Redbubble)
It is estimated that climate change is already causing about $1.3 Trillion dollars in damage every year, most of that being borne by small countries. At COP29 last year the richer nations promised $300 billion to help mitigate the cost of climate change but in the end only $26 billion was raised. At COP30 no definite figure was announced so it is likely that the money actually raised will be even less than last year.
The destructive winds of hurricane Melissa were about 15% stronger because of global warming. How much more destruction was there in Jamaica because of that increase? (Credit: Bloomberg.com)
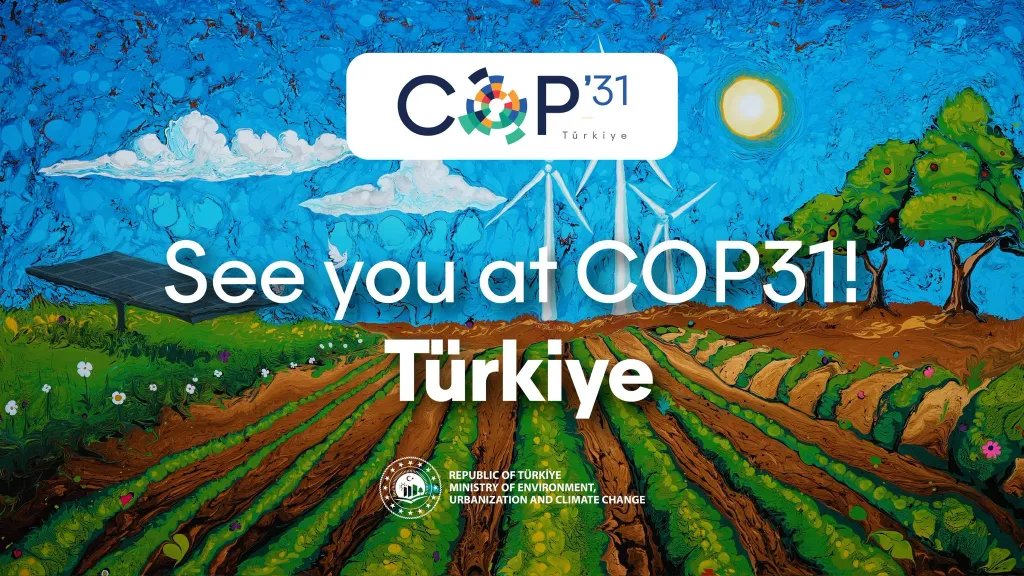
Even the question of what country should hold next year’s COP31 conference turned into controversy. Both Turkey and Australia wanted the honour, actually there’s money to be made from having so many big high muckety mucks come to your country, and both had the backing of other countries. In the end it was decided that COP31 will take place in Turkey, but Australia will chair the conference, which sounds to me like a disaster waiting to happen.
Next year’s COP31 will be held in Turkiye but will be chaired by Australia, that’ll work well I’m sure. (Credit: SETA)
But then there are many people who have decided that the entire COP process for fighting climate change has become a disaster that year after year achieves nothing. Ten years ago, in Paris the world agreed to limit temperature rise to 1.5ºC above pre-industrial levels but in the past two years we’ve already exceeded that figure and still our world leaders dither about doing anything real to keep temperatures from increasing still further.
It was ten years ago now in December of 2015 that Space X Corporation first pulled off the astounding feat of safely landing the first stage of their Falcon 9 rocket. Only a little more than a year later in March of 2017 Space X went one step further and reused a Falcon 9 first stage, even safely landing the booster stage for a second time. Since then the Hawthorn, California company has landed and reused hundreds of first stages, the current score is 528 soft landings but the figure keeps on going up every couple of days. Space X has already launched over one hundred Falcon 9s so far this year. All this reuse of the most expensive part of a launch system has allowed Space X to dramatically reduce the cost of getting a payload into space, dollars per kilo to orbit.
Space X has even succeeded in the feat of landing two of its Falcon 9 first stages at the same time, as a part of their Falcon Heavy configuration. This reusability is the key to reducing the cost of getting into space and therefore just increasing the amount of stuff we can put into space! (Credit: Teslarati)
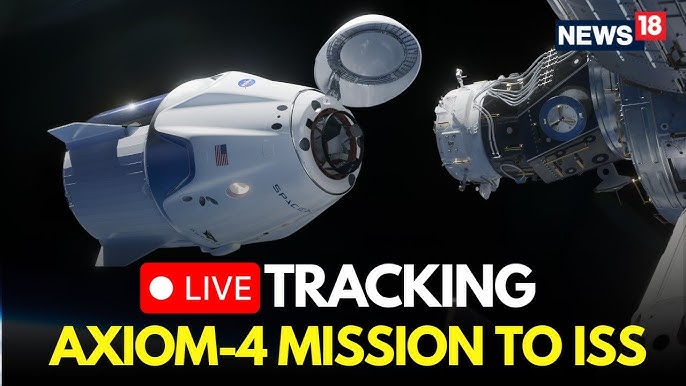
Because of that reduction in cost Space X is able to just put more things into orbit, whether it be Elon Musk’s Starlink satellites or other commercial satellites of even people. Space X not only routinely sends astronauts to the International Space Station (ISS) but it has also carried out eight privately funded space missions.
The Axiom-4 space capsule docking at the ISS. The fourth privately funded space mission to the ISS Axiom also has plans to maintain future private space stations. (Credit: YouTube)
Thanks to their monopoly on reusable rockets right now more than half of all space launches are by Space X simply because of its ability to reuse its Falcon 9 first stage. That monopoly may not last much longer however for there are currently several corporations and nations that are working hard to develop their own version of a reusable rocket.
Launch of the New Glenn rocket from Blue Origin. Like the Falcon 9 the first stage of New Glenn is intended to be capable of safely landing and being reused. (Credit: Next SpaceFlight)
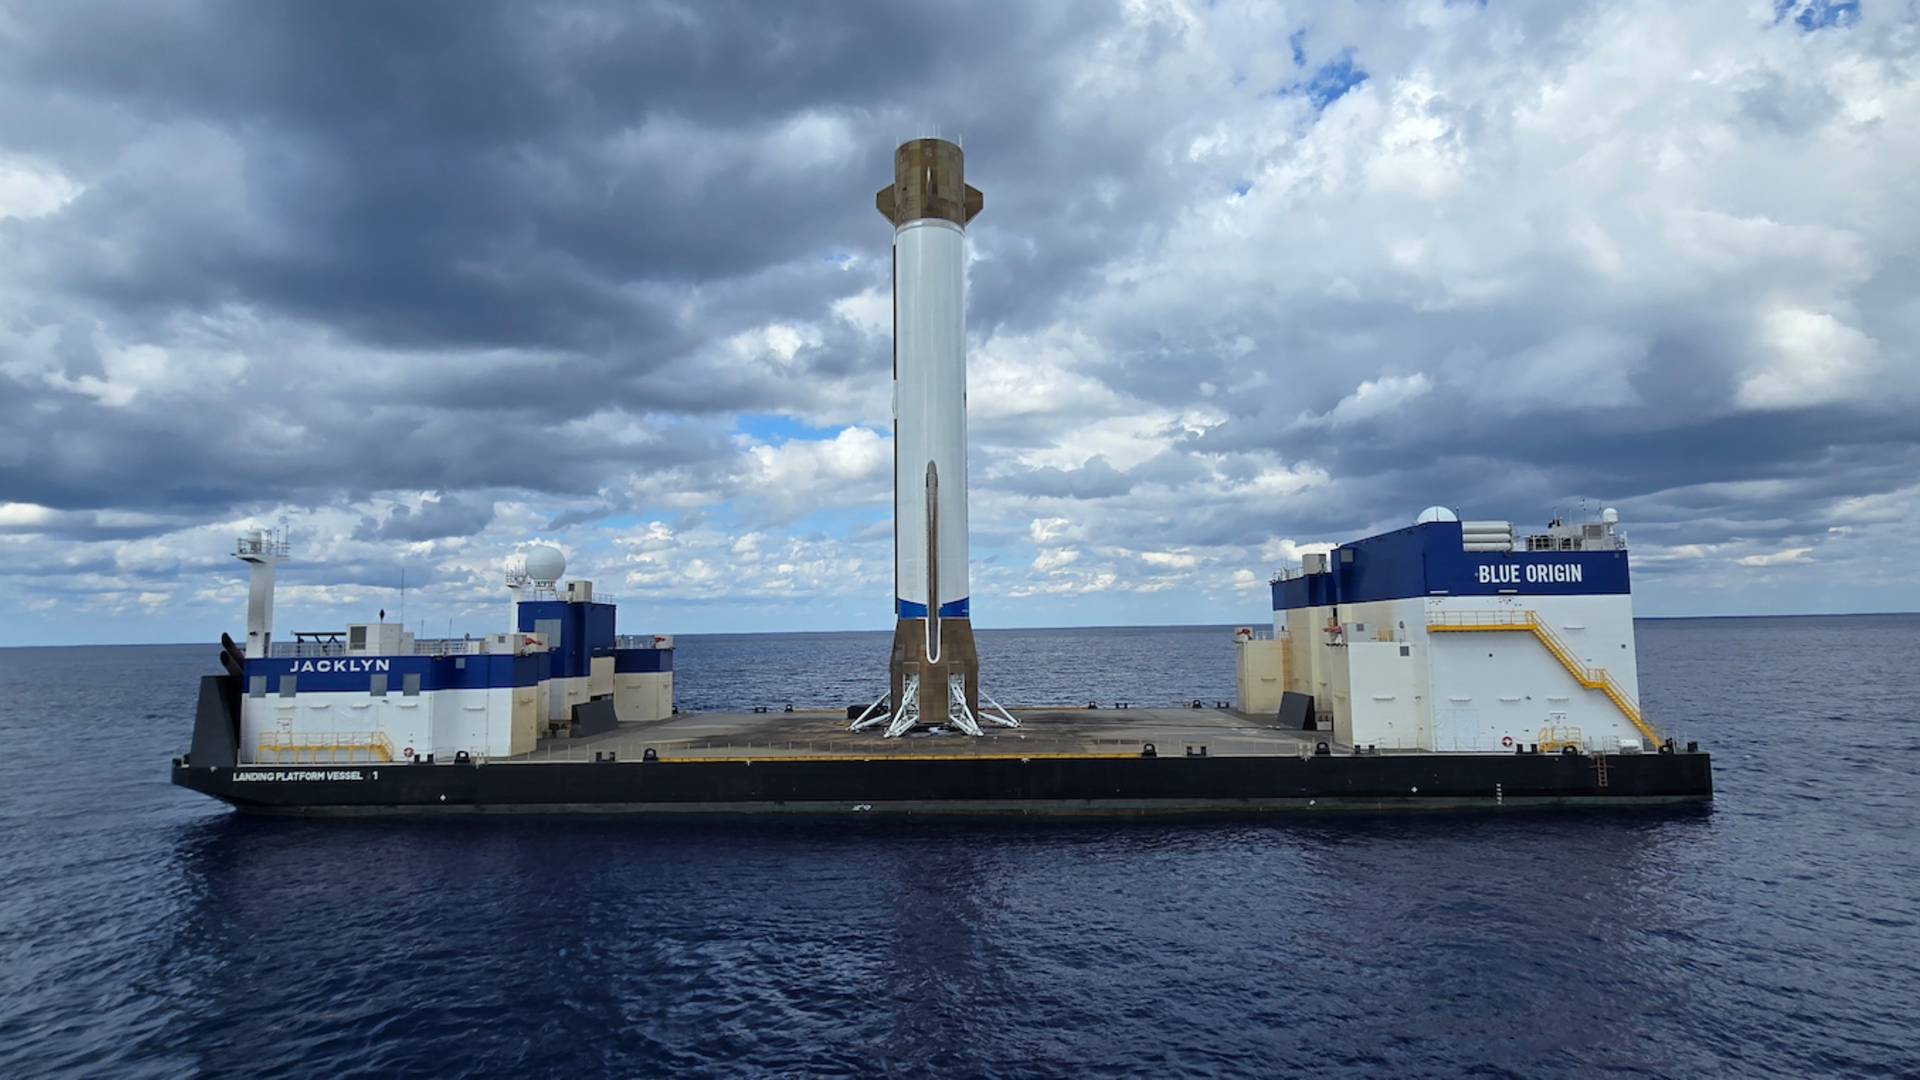
In fact Blue Origin Corporation has just succeeded in accomplished that task during the second test launch of their New Glenn rocket this month. On the 13th of November, after several delays due to weather and even a coronal mass ejection from the Sun, New Glenn carried out all of its mission objectives including a pinpoint landing of the first stage on a drone landing ship in the Atlantic.
New Glenn’s first stage sitting comfortably on its landing ship. (Credit: New York Times)
Like the Falcon 9, New Glenn is designed to have a reusable first stage. During the rocket’s first test launch back in January the rocket did succeed in placing a test payload into orbit, however the first stage’s engines failed to reignite so there was no soft landing.
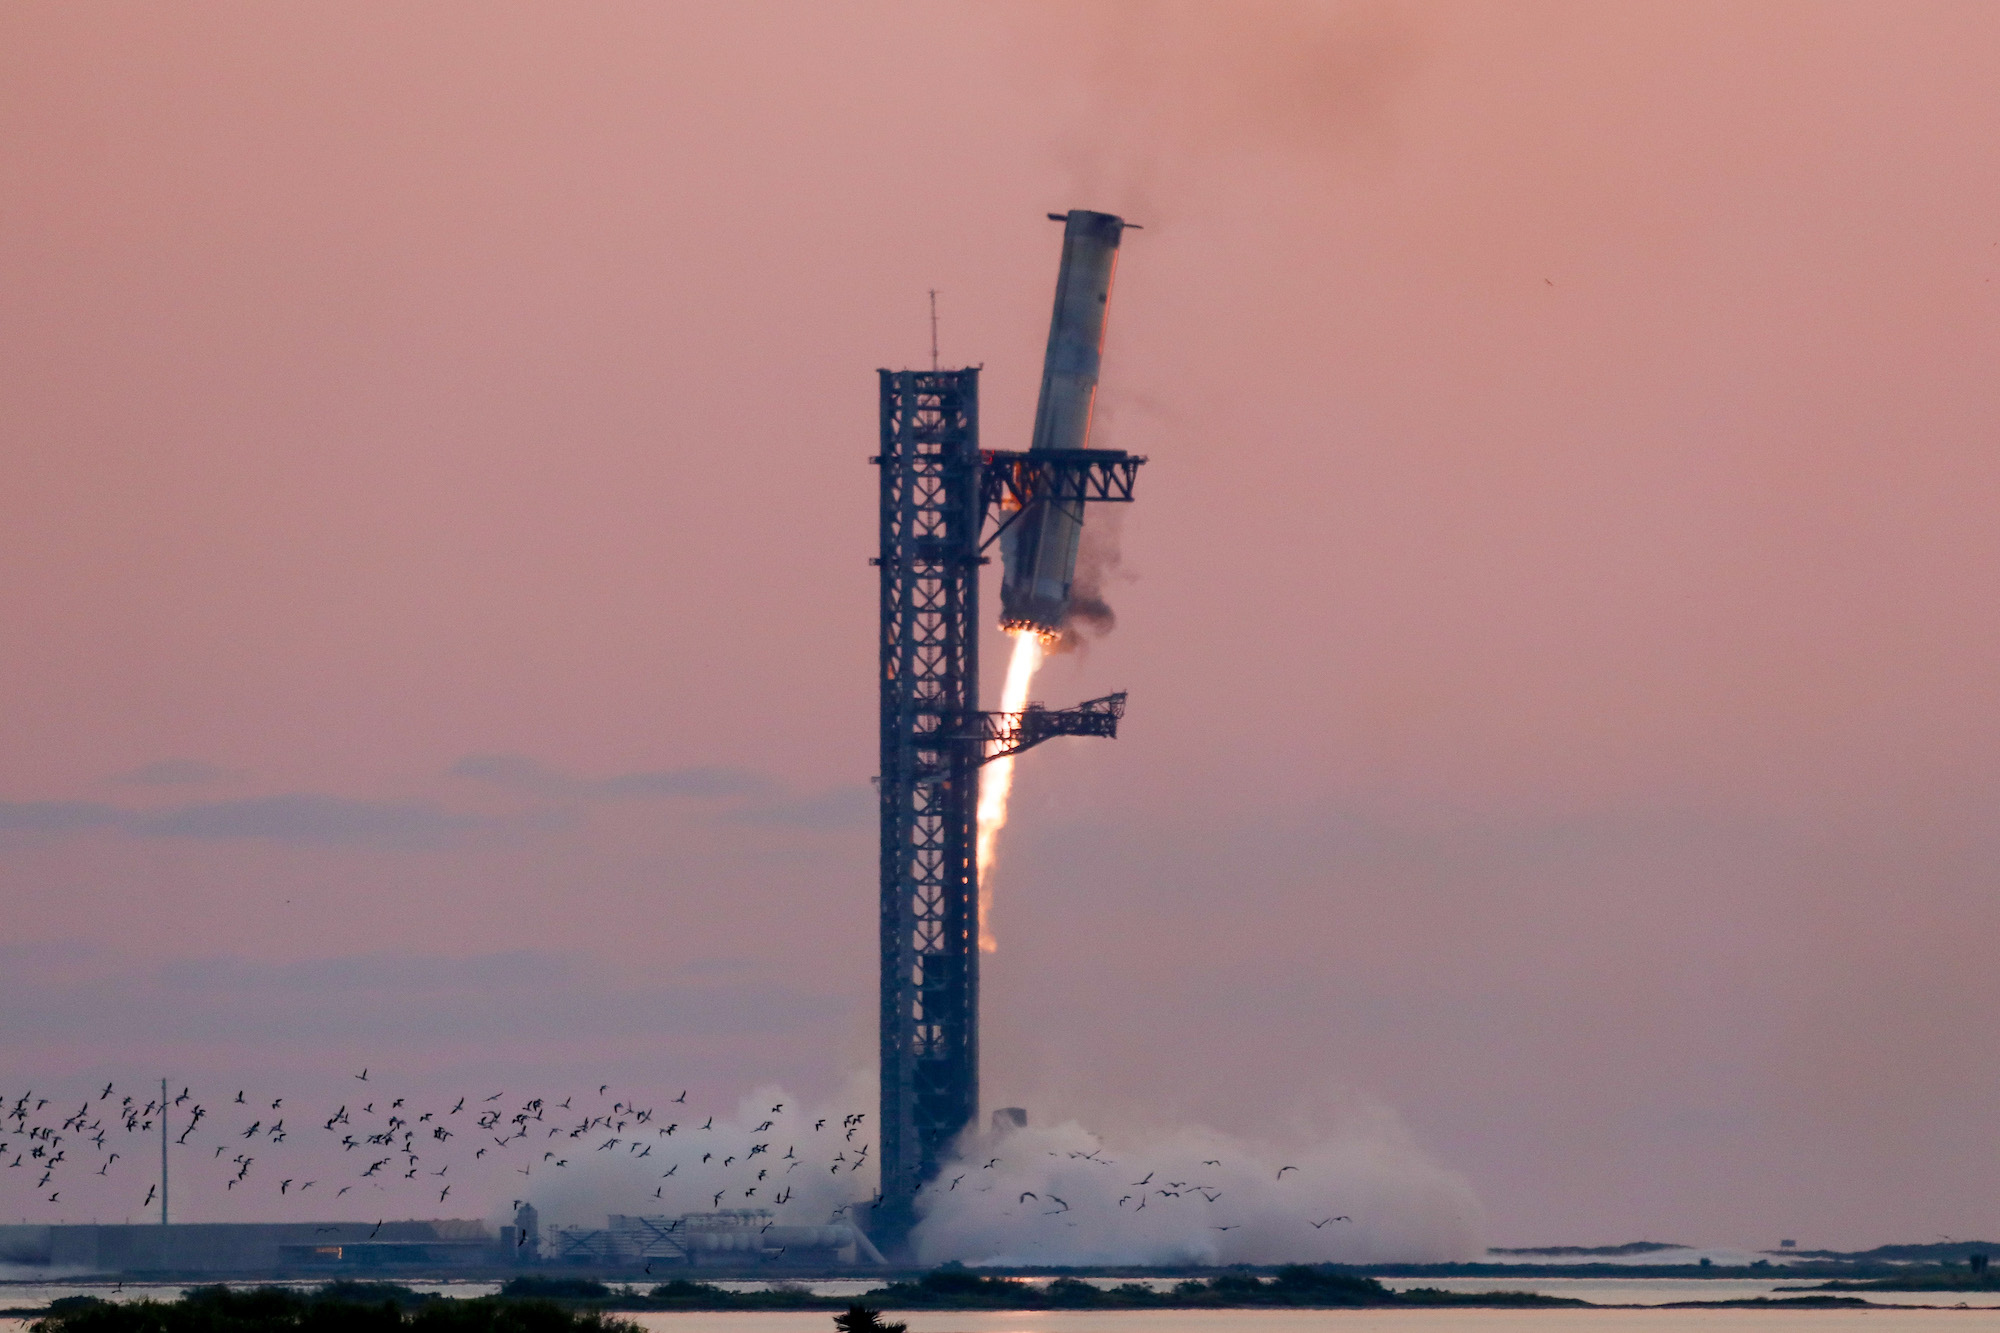
Space X has also succeeded in ‘catching’ the first stage of their larger Starship rocket. They’re working on catching the second, orbital stage which if they succeed would make the entire launch system reusable! (Credit: Ars Technica)
Now just because Blue Origin has managed to successfully land New Glenn’s first stage it doesn’t quite mean that Space X’s monopoly is over, not yet at least. After all it took Space X a couple of years to experiment, try various configurations and gain procedural experience before they got the whole reusability thing down pat. So it will probably take Blue Origin about the same amount of time before it can be reusing New Glenn’s first stages routinely. Still, there’s no doubt that Space X will be hearing footsteps coming up behind them from then on.
China has successfully tested a reusable sub-orbital rocket and plans a first launch of a reusable orbit capable launch system soon. (Credit: Space)
With so much to gain by reusability it’s not surprising that others are also working to develop rockets that can soft land and then be reused. China in particular has invested a great deal of money and national prestige in its space program and they are known to be working on a reusable rocket. Of course much of what China does is kept a secret but we do know that several reusable rockets are being developed.
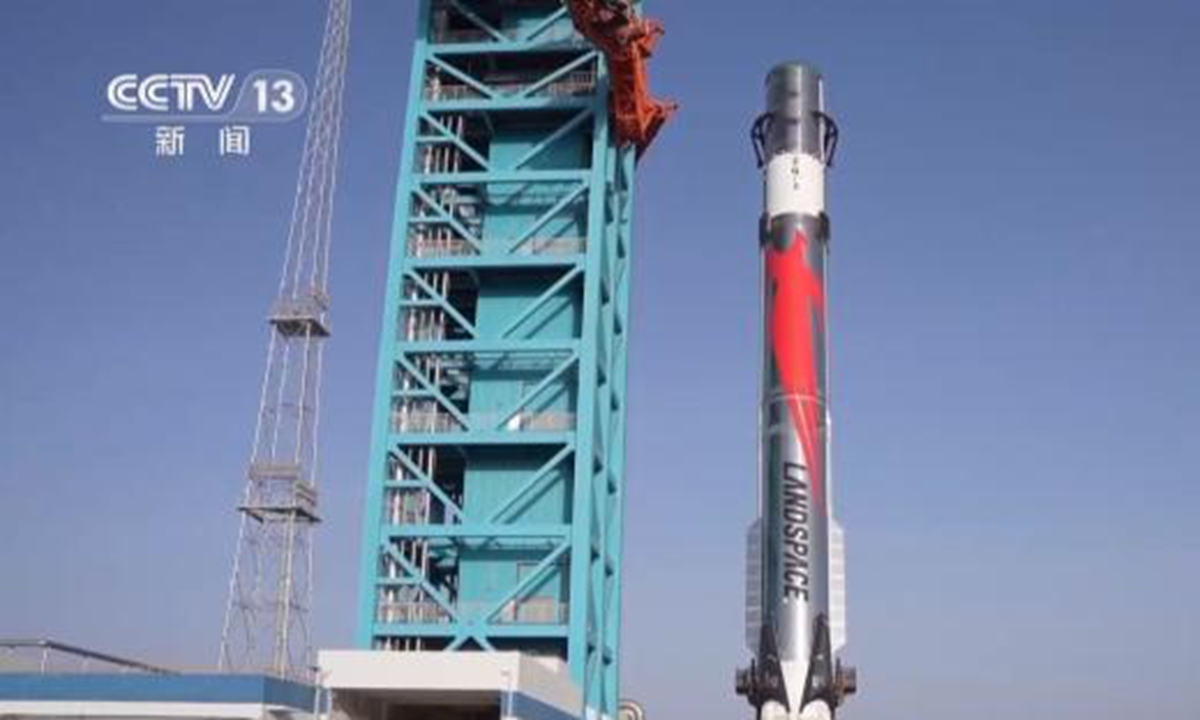
The Zhuque-3 first stage being assembled on its launch pad. China hopes to conduct a full test of this reusable first stage before the end of this year. (Credit: Global Times)
Probably the most advanced Chinese rocket is the Zhuque-3 built by the Chinese aerospace firm LandSpace. Looking a great deal like the Falcon-9, the Zhuque-3’s first stage is intended to be reusable. Back on the 20th of October the Zhuque-3 successfully carried out a static test of its nine Tianque-12A engines in preparation for a maiden flight later on this year. Like Blue Origin on that first flight the Chinese engineers will attempt to safely land the first stage but whether they succeed or not LandSpace is certainly making progress.
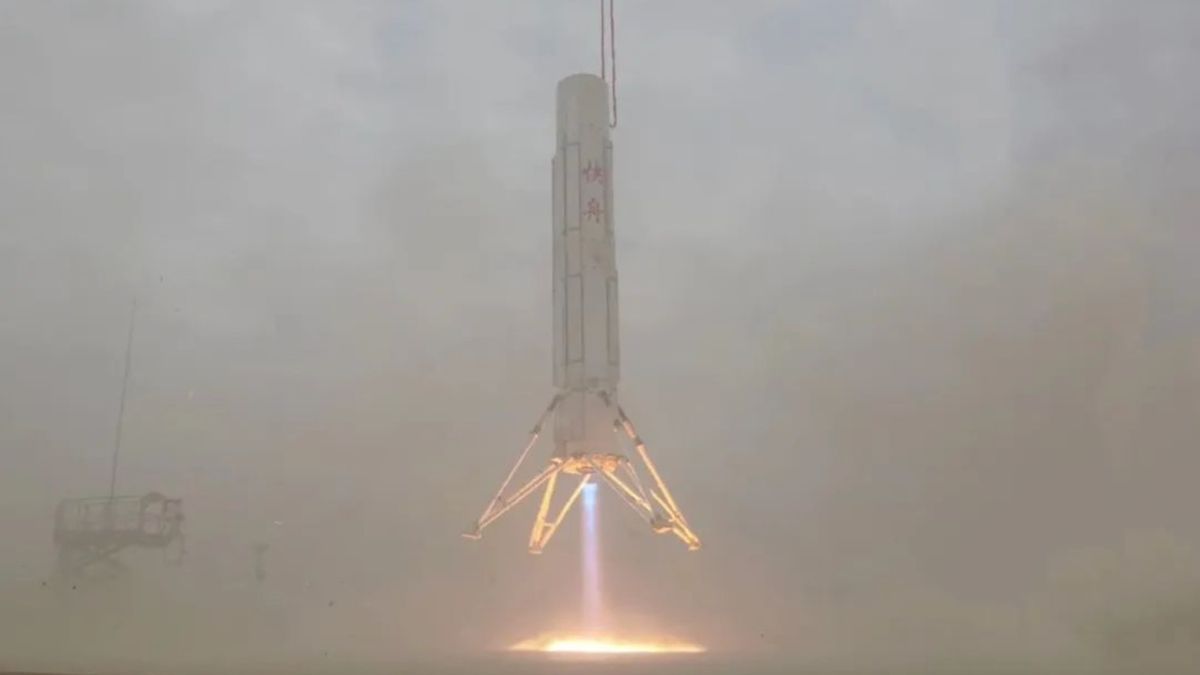
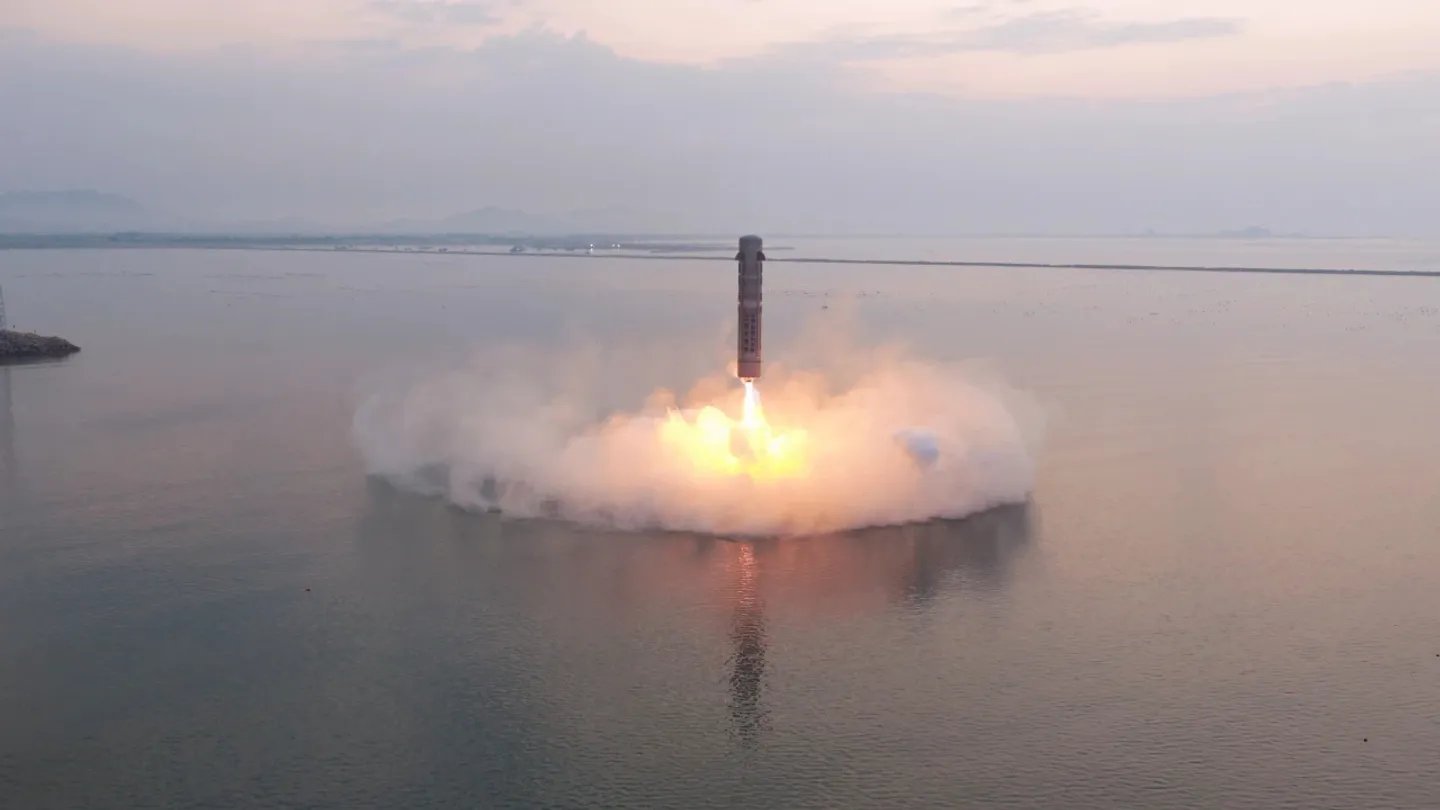
Pretty incredible sight to see a rocket hovering above the water but that’s what the Yuanxingzhe-1 is doing here. (Credit: TRT World)
As is another Chinese company called Space Epoch whose sub-orbital test vehicle the Yuanxingzhe-1 was launched back in May from a platform in the Yellow Sea, rose to an altitude of 2.5 km and hovered there before returning to make a soft landing on its original platform. So, one Chinese firm is ready to test a reusable rocket capable of launching a payload to orbit while a second has successfully tested a reusable sub-orbital rocket. It’s only a matter of time before China has a reusable launch system similar to Space X.
Half of the engineering problems with reusable rockets is designing an engine whose thrust can be controlled to a fine degree. Here’s Europe’s Prometheus engine undergoing testing. (Credit: European Space Agency)
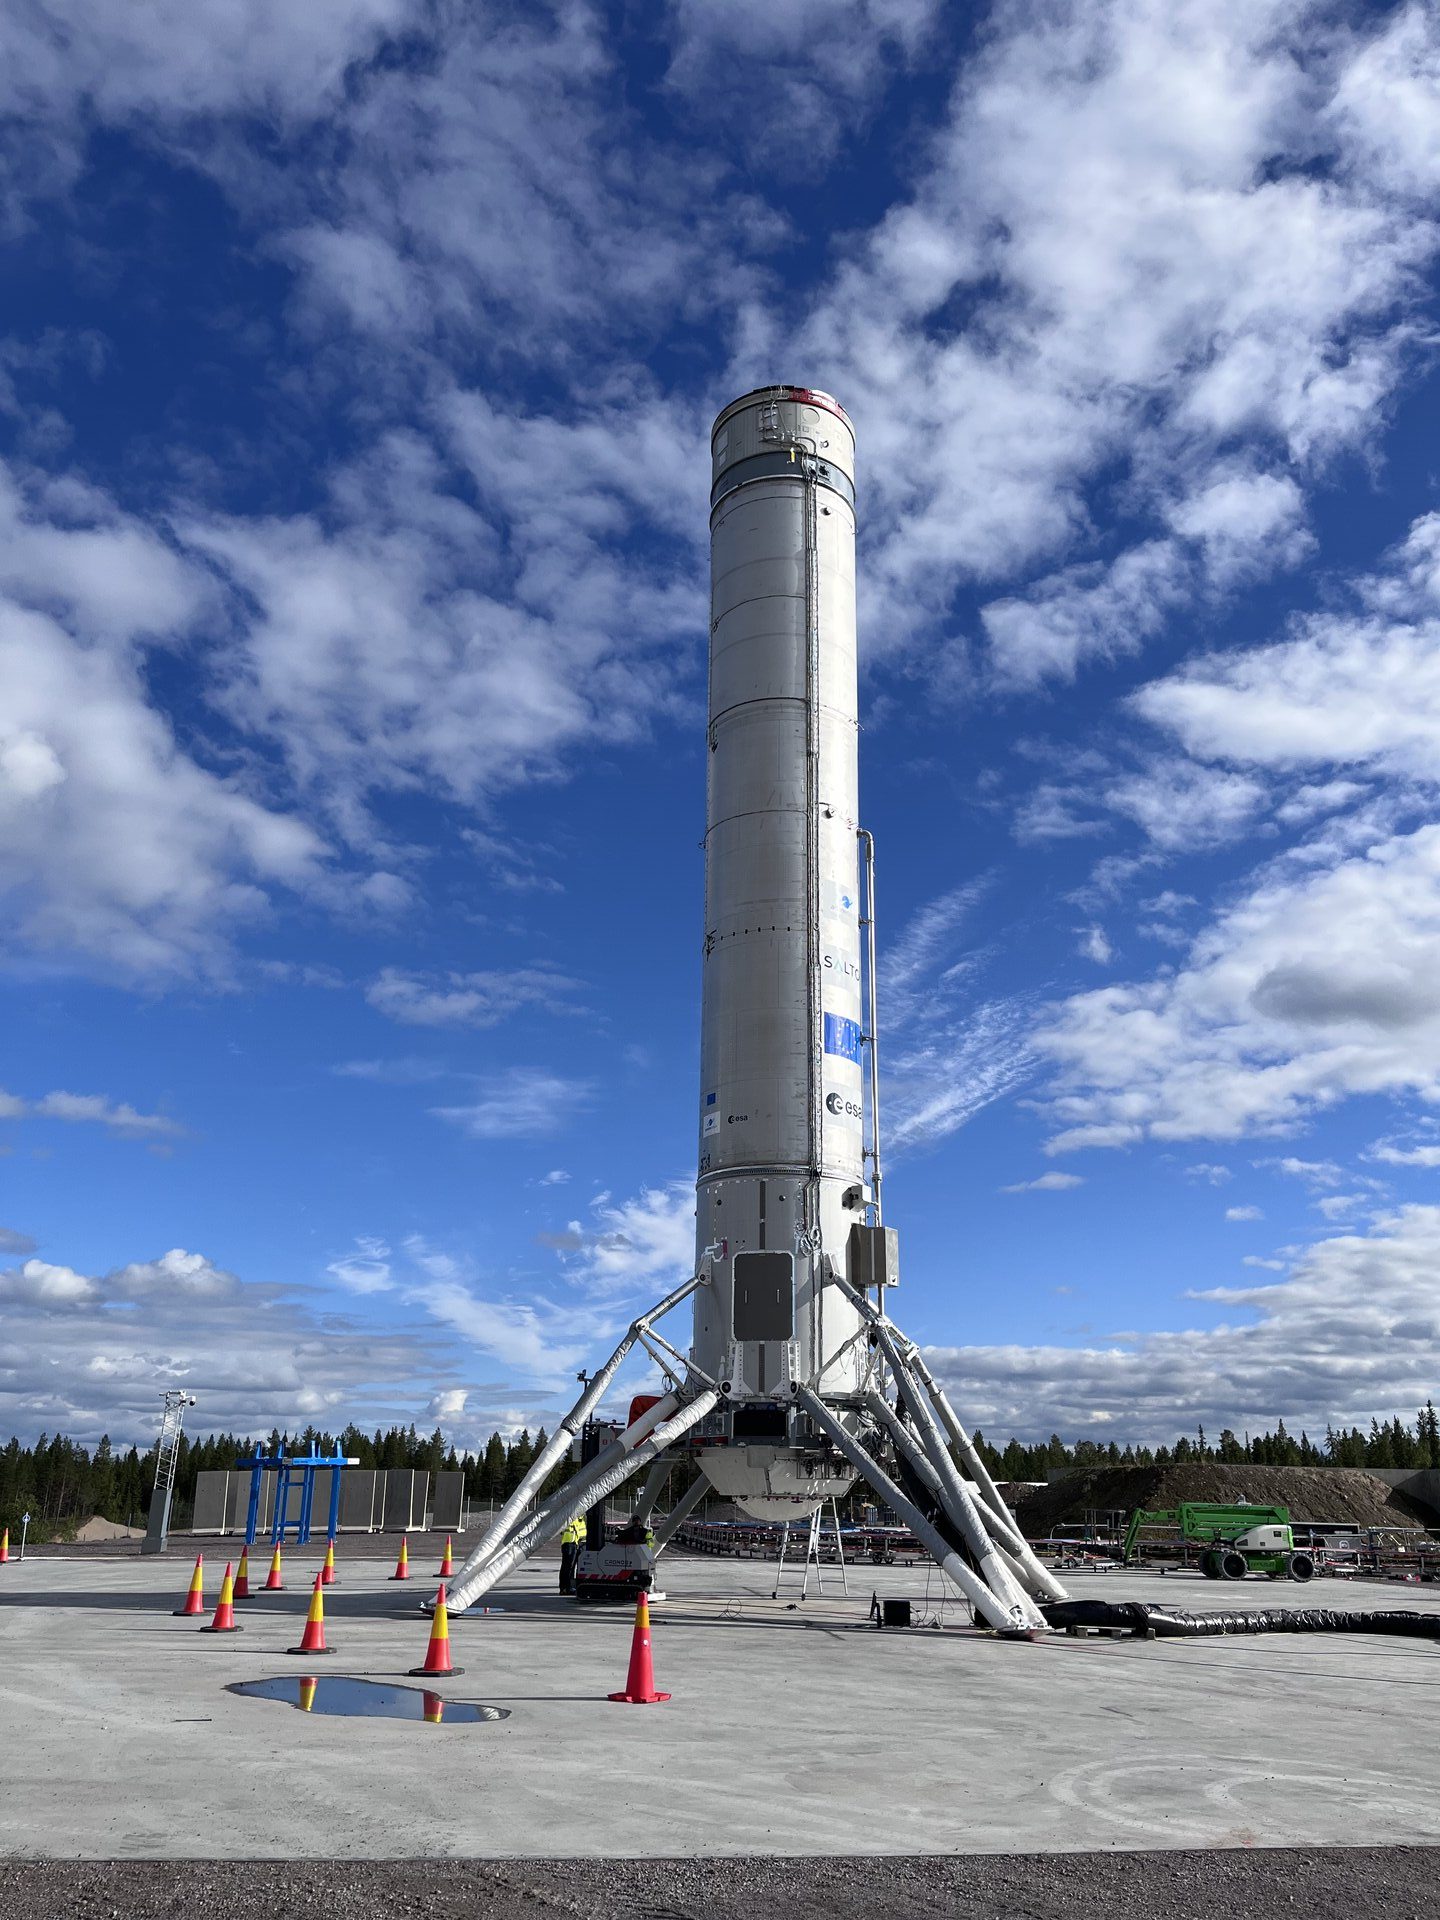
Meanwhile in Europe there’s the ArianeGroup which is planning a series of short, non-orbital tests of reusable rockets in the hopes of generating interest in the European Space Agency (ESA) for European reusable rockets. The tests will be carried out in Sweden near the Arctic Circle and are built around a reusable methane-oxygen rocket engine named Prometheus that will power three test vehicles named Callisto, Themis and Skyhopper.
Themis is one of the test rockets that the ESA will use to develop a reusable launch system. (Credit: European Space Agency)
Themis will be tested first on a low altitude flight with a set of permanent landing legs installed while Callisto will have foldable landing legs similar to those on Falcon-9. Skyhopper will be last with a higher altitude, multi-engine flight. The problem with any new rocket developments in Europe is political will. With so many nations involved in the ESA, and the fact that the ESA has always had NASA to fall back on when necessary the ESA has never been able to do anything really big in space.
The ESA has already awarded a contract to build the recovery vessel for their reusable rockets. (Credit: European Spaceflight)
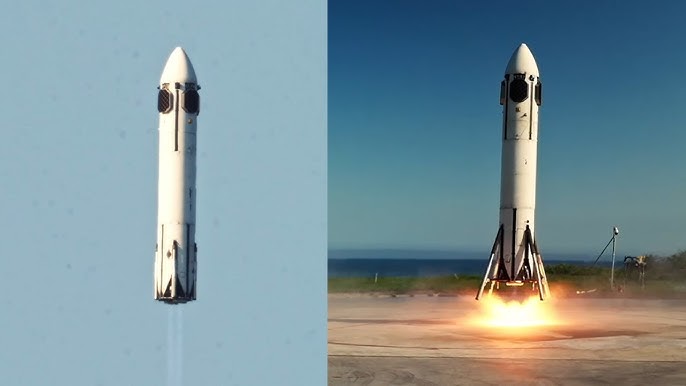
Of course Japan is also getting in on the act. Back on June the 17th the giant carmaker Honda successfully tested a small, 6.3m in length, reusable rocket. During the test the rocket reached a height of only 300m but touched down only 37cm from its target landing spot. Throughout the test the rocket was completely under control. The company has set its sights on a larger scale, sub-orbital flight in 2029.
Honda’s reusable test rocket in action. (Credit: YouTube)
Finally let’s just pity poor Russia, which appears to have no plans for developing reusable rockets. Thanks to Vladimir Putin’s mismanagement, to say nothing of his war in Ukraine, Russia’s economy is in such a bad state that the first nation in space is now steadily falling behind.
Meanwhile Russia just keeps on using basically the same launch system that put Sputnik into orbit! (Credit: NASA)
So there you have it, while Space X has built themselves a dominant position in space based upon their reusable Falcon 9 rocket that dominance could soon start to slip now that other nations and companies have seen the advantages of reusable rockets.
This post was intended to be about developments in reusable rockets but recent happenings at the Chinese Tiangong space station require a bit of discussion. On the 31st of October a new crew of three Taikonauts arrived at the Tiangong space station aboard their Shenzhou 21, relieving the Shenzhou 20 crew. However, as the two crews were both aboard the station the Shenzhou 20 capsule was struck by space debris.
There are currently tens of thousands of pieces of space junk in orbit. This is becoming a big problem as those pieces can be traveling at thousands of kilometers per hour! (Credit: Rocket Factory Augsburg)
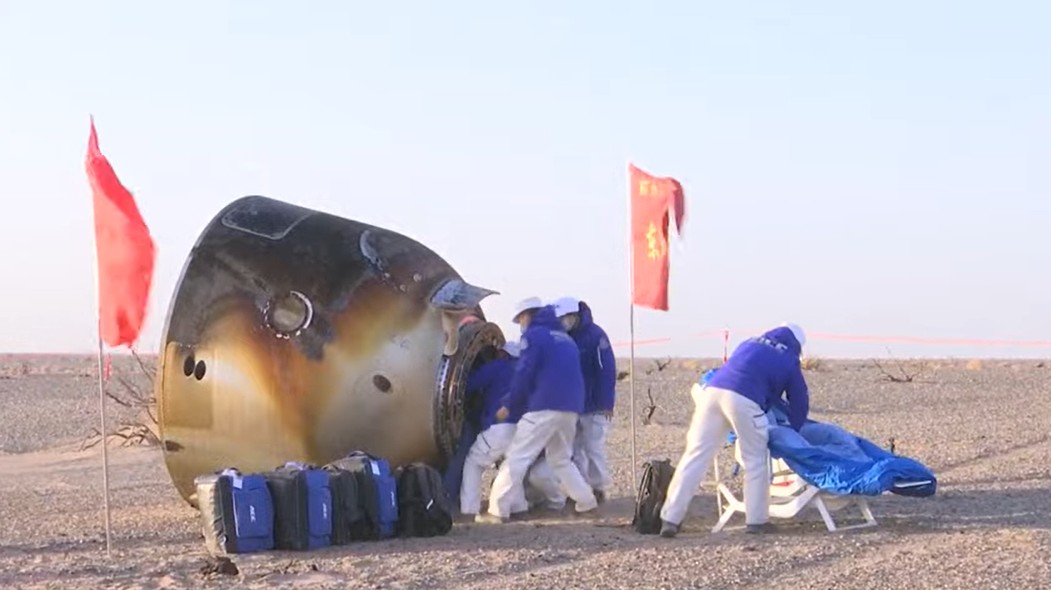
Officials with the Chinese space agency immediately ordered a delay in the return of the Shenzhou 20 crew while engineers analyzed the data to determine if the capsule was safe. After more than a week of delay it was decided that the Shenzhou 20 capsule was unsafe and the Shenzhou 20 crew would return to Earth aboard the Shenzhou 21 capsule.
The Shenzhou 20 crew returning aboard the Shenzhou 21 capsule, leaving the 21 crew in orbit without a way of getting back to Earth. (Credit: SpaceNews)
On the 14th of November the Shenzhou 20 crew did safely land back on our planet but in doing so they left the Shenzhou 21 crew stranded on Tiangong without a safe capsule in which to return if an emergency should occur. As you can imagine China is now rushing to launch an unmanned Shenzhou capsule, the one slated for the Shenzhou 22 mission, to Tiangong as quickly as possible. The Chinese space agency has announced a tentative date of November 25 for the launch of that unmanned mission.
Calling all of you weather geeks out there, you know who you are. Have I got a book for you! ‘Cloud Warriors’ by Thomas E. Weber is an extensive and comprehensive survey of all of the latest advances in weather forecasting. Dealing with all of the many different types of severe weather, tornadoes, hurricanes, droughts, wildfires, flooding and even good weather ‘Cloud Warriors’ also tracks the newest developments in how weather forecasts are conveyed to the people who need to know what kind of weather is coming, government officials, business leaders, farmers as well as the general public.
Cover art for ‘Cloud Warriors’ by Thomas E. Weber. (Credit: MacMillian Publishers)
The chapters in ‘Cloud Warriors’ are divided into the main issues of weather forecasting, both the different types of severe weather as well as computer models and long-range forecasts. Running through the entire book however is a theme concerning the three pillars of modern weather forecasting, government agencies such as the National Weather Service (NWS) along with academia, that is the scientists at universities like Penn State whose observations and theoretical work advance our understanding of weather. The third pillar is kinda the new kid on the block, the commercial weather services such as Accuweather who provide individualized weather forecasts to their customers, for a fee.
Weather is a big part of every day of our lives. For good or ill we need to understand weather and the people who predict the weather for us. (Credit: National Geographic Education)
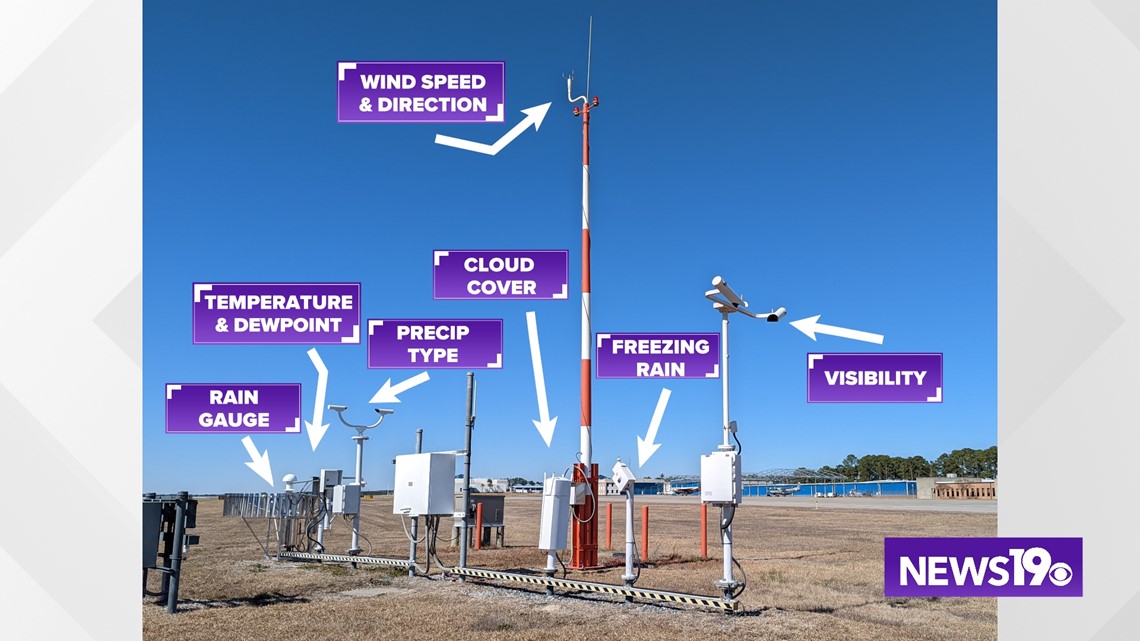
Several times in ‘Cloud Warriors’ author Weber makes the argument that all three of these pillars have an important role to play in modern weather forecasting. The Federal Government possesses thousands of weather stations spread across the country, basically one at every airport, as well as specialized weather assets such as the hurricane hunter airplanes that fly into the center of tropical storms to obtain the data needed to predict how strong a storm will become, and where it will go.
Every airport in the US is mandated to have a weather station connected to it. This huge amount of data makes the National Weather Service the largest factor in predicting the weather days from now. (Credit: WLTX)
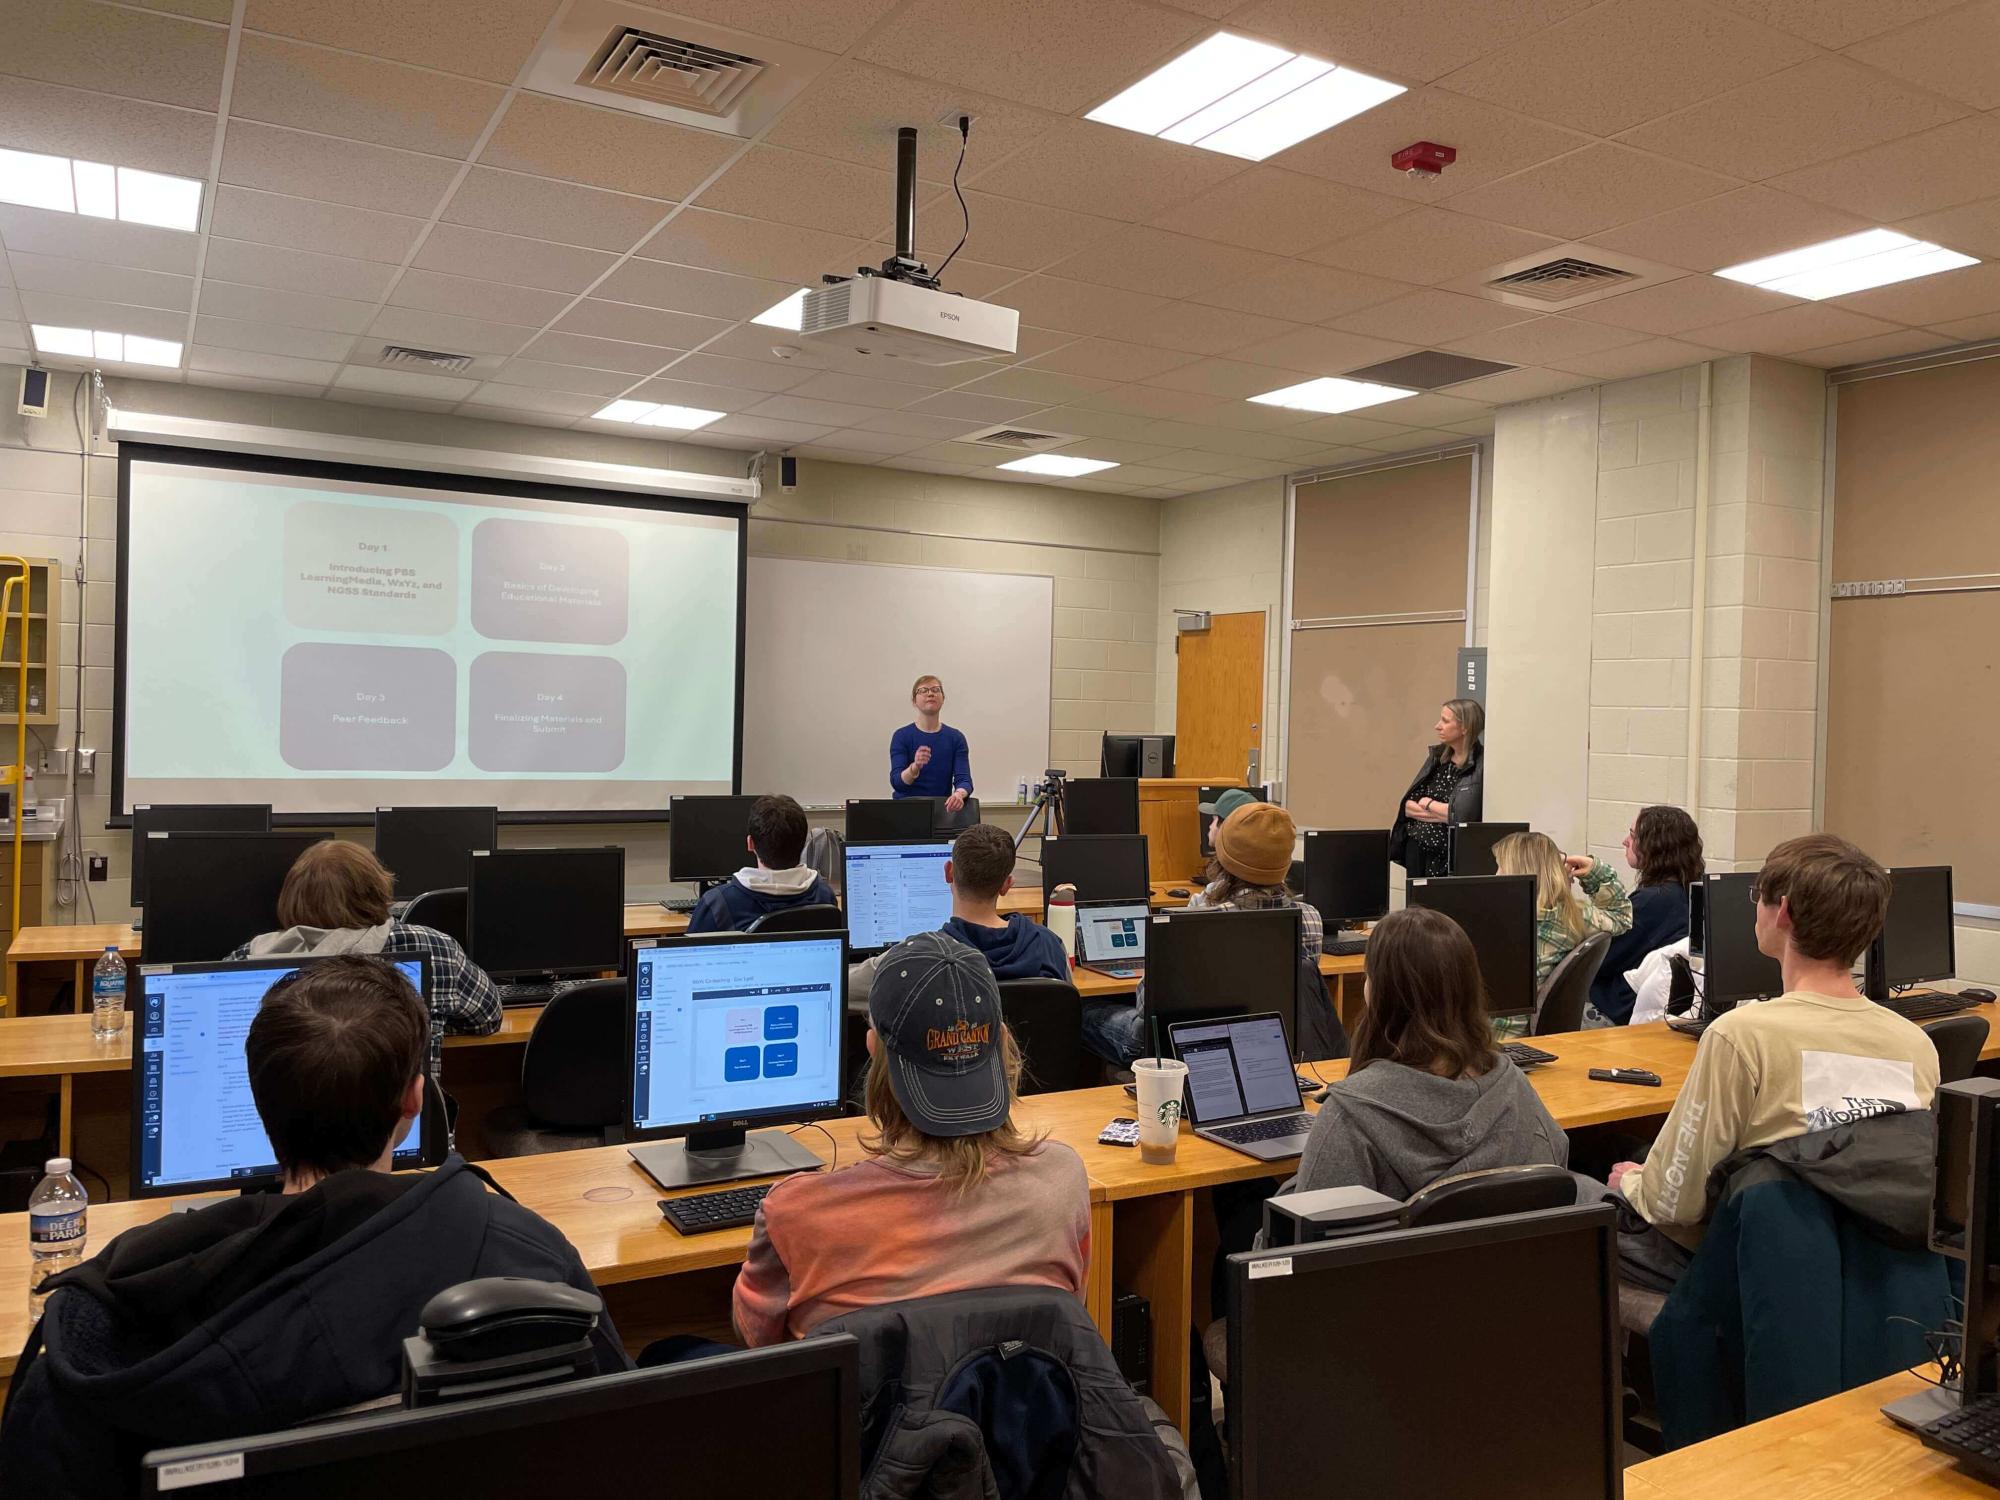
Meanwhile the scientists who study weather at colleges around the country are at the forefront of making weather predictions more accurate. It’s a fact that a seven day forecast today is as accurate as a five day forecast was twenty years ago and as accurate as a three day forecast was fifty years ago. This improvement in forecasting has been achieved by both a greater understanding of the physics of our atmosphere and also by ever more sophisticated computer models.
Meteorology class at Penn State University. Highly regarded for its program many of the graduates of PSU go on to careers as TV weathercasters or scientists studying the weather. (Credit: Penn State)
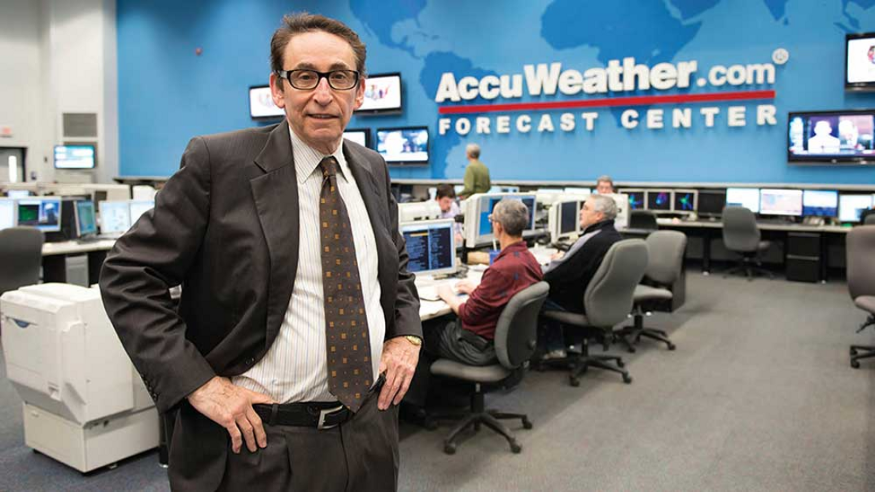
The newest player in weather forecasting is the commercial weather service such as Accuweather. Because these weather companies are so new they currently have the greatest potential for growth as other industries, such as airlines, construction companies and large-scale agri-businesses find they have a growing need for accurate weather forecasts not over a large area but for extremely small areas. What the author terms hyperlocal weather.
Dr. Joel N. Myers, the founder and CEO of Accuweather. A graduate of Penn State his company’s headquarters is just off campus. (Credit: Bitbean)
Now you may suppose that the growing problem of climate change is one of the main topics in ‘Cloud Warriors’ but actually the book is primarily concerned with how our weather forecasts are made and what improvements in accuracy we can hope for in the years to come. Nevertheless climate change certainly does get mentioned time and time again as its effects are already being felt in the number and strength of severe weather events while future weather predictions will have to take into account its growing influence.
While Climate Change is not the focus of ‘Cloud Warriors’ nevertheless its growing importance causes it to crop up in almost every chapter. (Credit: Wikipedia)
There’s one more theme the author Weber stresses in ‘Cloud Warriors’ and that is improvements in the way that meteorologists communicate their forecasts to both government officials and the general public. Think about it, a forecast that predicts a hurricane will strike a certain location is no good if the people living there don’t hear it or ignore it.
Wasn’t so long ago that TV meteorologists had an actual metal board that they placed magnets onto in order to discuss the weather forecast. (Credit: Facebook)
I can remember back in the 1960s when the nightly weather report on the local news consisted of a five minute segment recapping what today’s weather was and then giving the three day forecast, on Thursday we’d also get a ‘weekend forecast’. Now, in 2025 we have radar maps showing where it’s raining, or if severe weather is approaching. We get watches or warnings about thunderstorms, tornadoes even hurricanes all so that we can better prepare ourselves for such severe conditions.
Today you’re local weathercaster has the latest video technology to enable them to communicate to their audience the dangers of severe weather. (Credit: YouTube)
As you can guess I definitely recommend ‘Cloud Warriors’ as an in depth survey of how we humans deal with one of the most important, and changeable parts of our daily lives, the weather. I said at the beginning of this post that ‘Cloud Warriors’ would be a big hit with weather geeks but maybe, with the threat of climate change and everything else, it should be on everyone’s reading list.
We’ve all heard of autism, we all know that it is a medical condition that consists of many types of emotional and mental disorders that first appear in children. We also know that more and more children are being diagnosed with autism, and we all know that autism has become a political battleground where accusations are being hurled back and forth with conspiracy theories being accepted without any evidence.
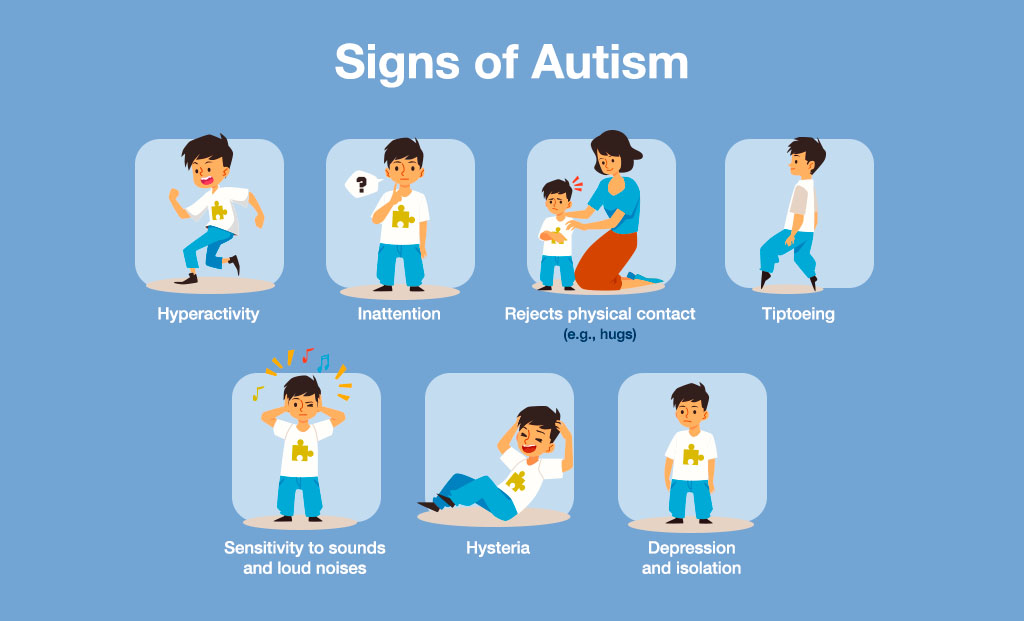
Some of the early signs of Autistic Spectrum Disorder (ASD) in a developing child. (Credit: Synlab)
In this post I hope to explain a few facts about autism, especially why it seems to be spreading. At the same time I’ll try to discuss at some length how autism has become a political rather than a purely medical issue. To do this I will begin with a little historical background.
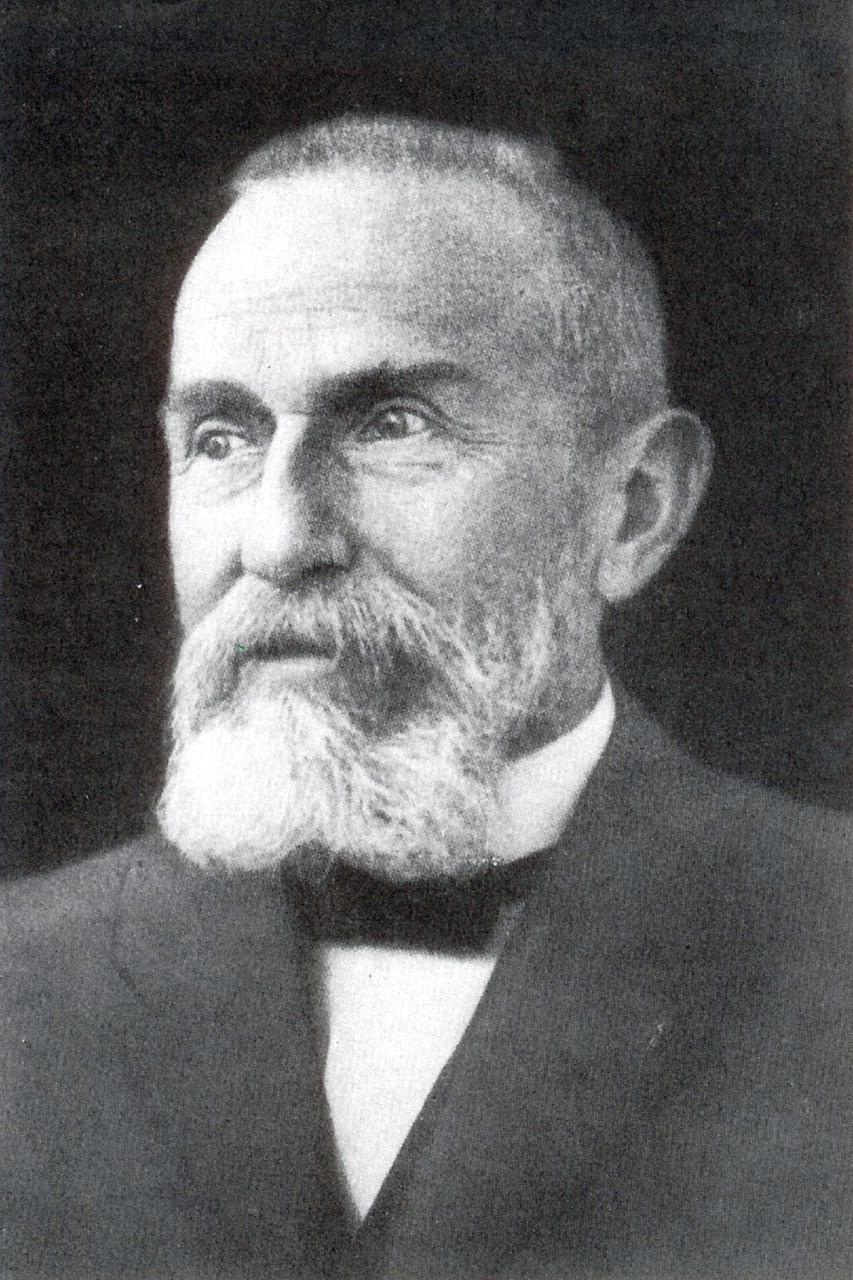
Paul Eugen Bleuler was a Swiss Psychiatrist who first used the term ‘Autism’ to describe a symptom of schizophrenia involving social withdrawal. (Credit: Psychiatry Online)
It was in 1912 that a Swiss psychiatrist named Paul Bleuler first used the term Autismus, from the Greek Autos meaning ‘self’, as a description for the social withdrawal he observed in patients suffering from schizophrenia. Bleuler’s work was further developed by a German psychiatrist named Fritz Künkel who characterized about 25% of schizophrenics as being autistic. This use of autism to describe symptoms of schizophrenia has now fallen out of favour.
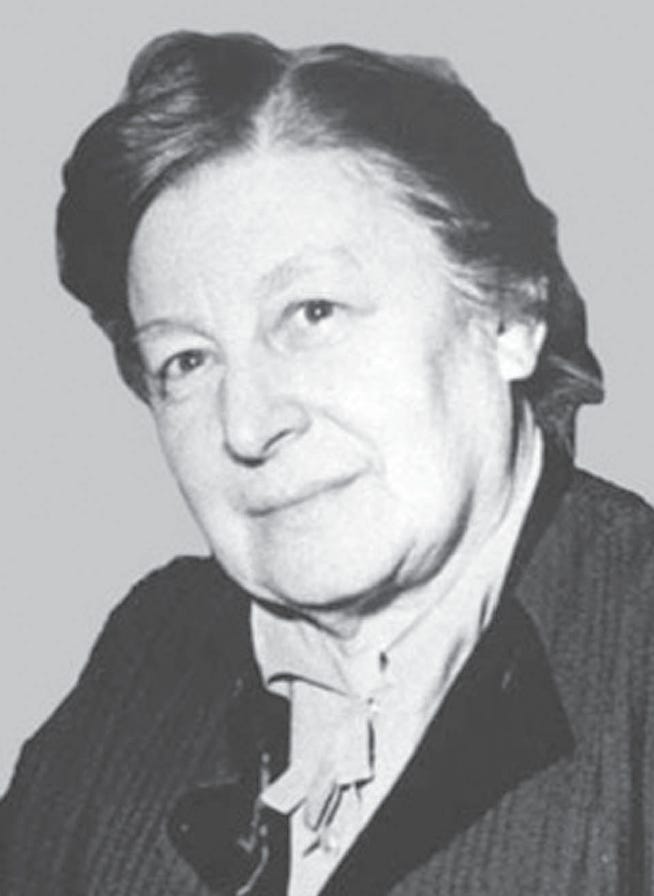
The first modern description of ASD was by Soviet psychiatrist Grunya Sukhareva who worked for 30 years developing her ideas about ‘autistic attitude’. (Credit: The Autside)
Then in 1926 a Russian psychiatrist named Grunya Sukhareva studied six young boys who were all intelligent and musically gifted but who tended to avoid social contact with other children. In her publications she referred to this behavior as an ‘autistic attitude’. Doctor Sukhareva continued her research for thirty years and is now given credit for the first modern description of autism. It was not until 1980 however, with the publication of the American Psychiatric Association’s Diagnostic and Statistical Manual of Mental Disorders, Third Edition (DSM-3) that autism was fully recognized as a mental condition separate from schizophrenia with its own symptoms and diagnosis.
The American Psychiatric Association’s Diagnostic and Statistical Manual of Mental Disorders, Third Edition (DSM-3) was the first medical reference to describe Autism accurately enough so that any medical professional could recognize it in their patients. (Credit: Psychiatry Online)
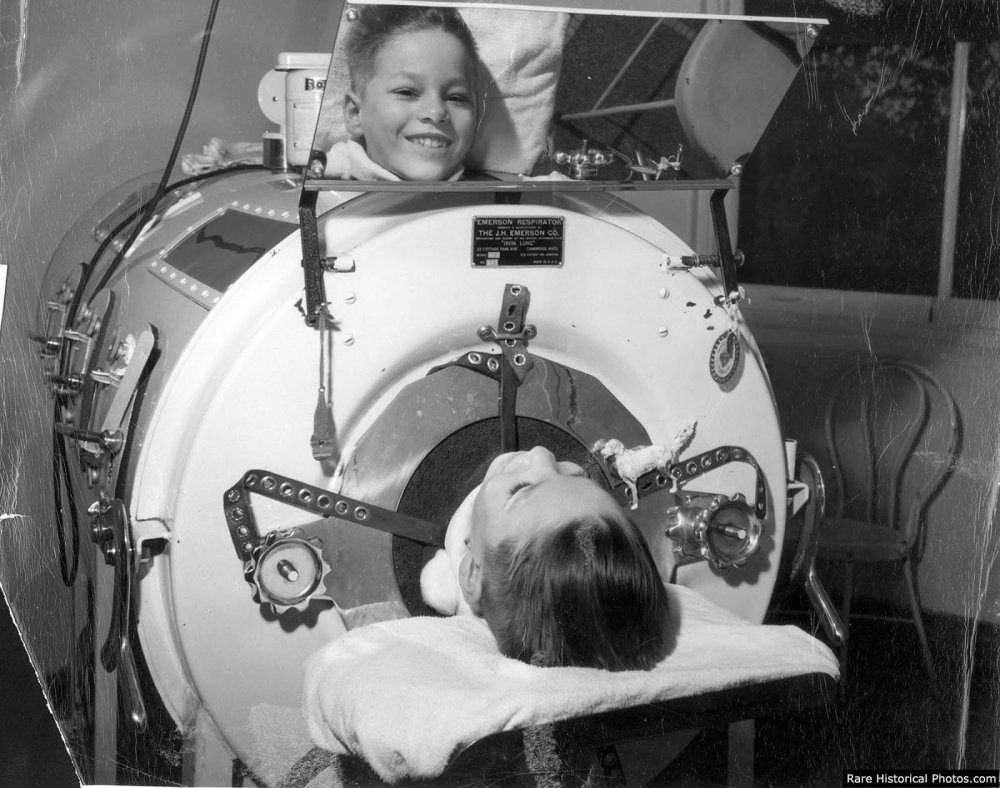
I’m going to make a brief, personal aside at this point. I grew up during the 1960s, before DSM-3 and therefore before autism was universally recognized as an actual disorder. At that time pediatricians were much more concerned with childhood diseases like polio, measles, whooping cough, even rickets. They simply didn’t have the time to even consider a child who had problems getting along with other children as having a ‘disorder’. It is the success that medical science has had with the diseases of my childhood that has allowed autism to become a medical issue. There always were autistic people but in the past the medical profession was paying more attention to infectious diseases rather than ‘behavioral issues’.
Not too long ago Doctors were much more concerned about diseases like polio that actually killed people to worry that much about behavioral issues like autism. (Credit: Science Museum)
So what are the symptoms of autism, how do we know if a child is autistic and why does it seems to effect only children. That’s several big questions at once and unfortunately much of the answers are still a matter of debate within the medical establishment. First of all strictly speaking autism is formally referred to as ‘Autistic Spectrum Disorder’ (ASD) because there is a very wide range of behavioral symptoms and many patients exhibit only a few of them and the degree to which a symptom is displayed can vary greatly.
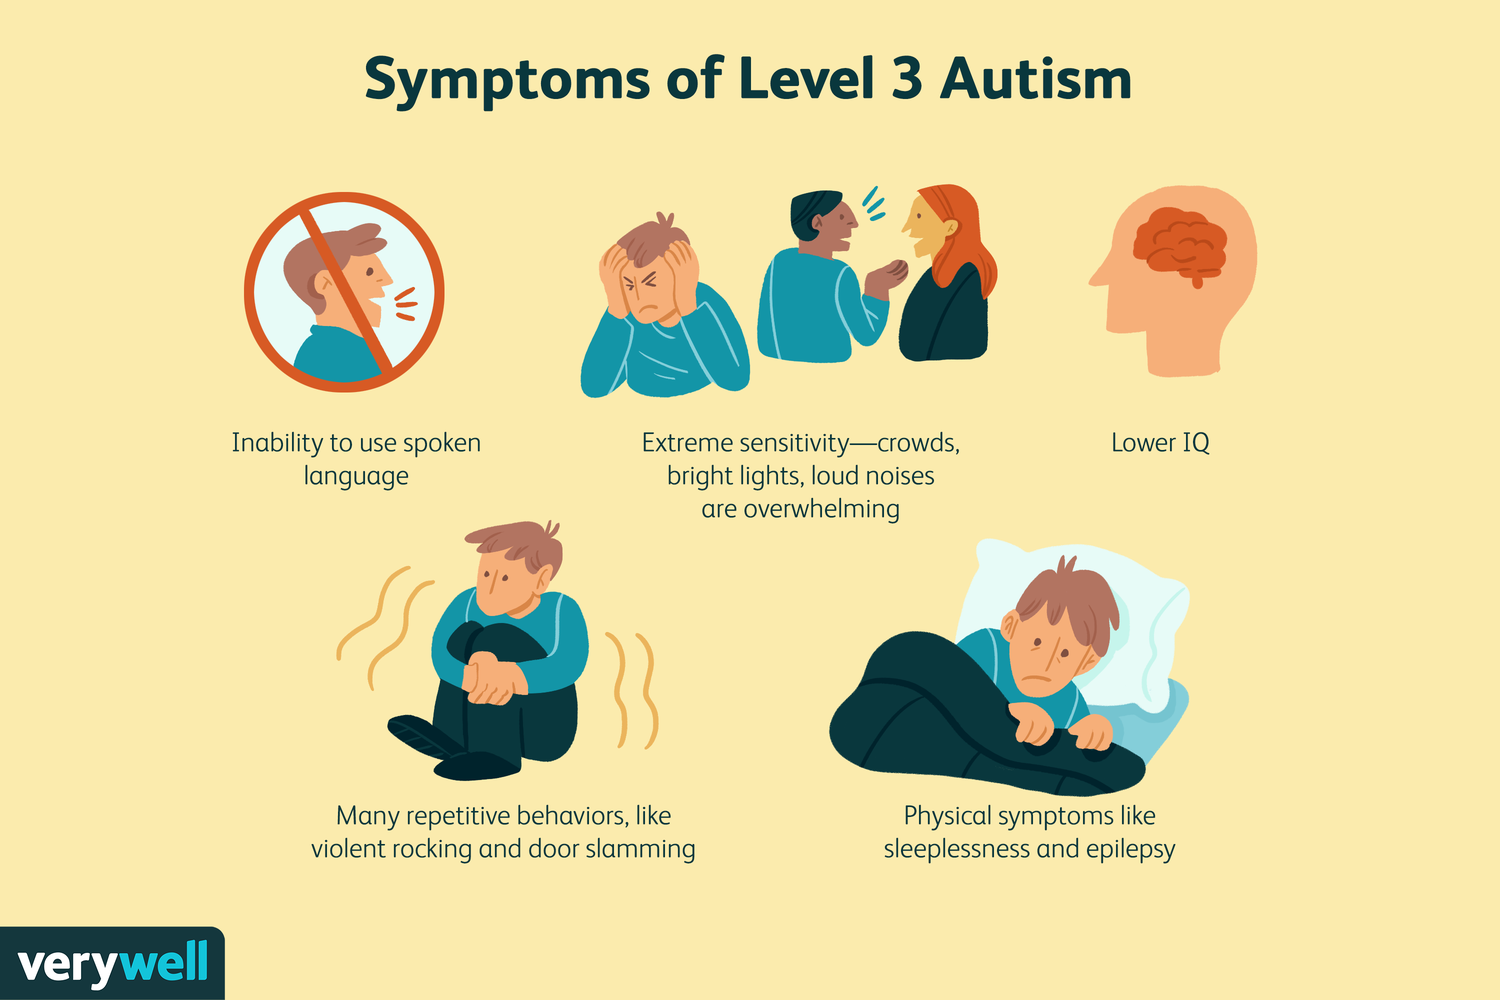
Severe symptoms of ASD are pretty easy to spot but remember there are a spectrum of symptoms so that it can be very difficult to distinguish between a mildly autistic patient and a functioning person who simply prefers their own company to more social activities. (Credit: Verywell Health)
The primary behavior that an autistic person would exhibit is difficulty in communicating with other people, avoiding social interactions, not looking another person in the eye when speaking to them, etc. At the same time an autistic person may show a tendency toward repetitive behaviors and interests. This repetitive behavior is considered to be part of the reason why some autistic people become gifted in a few areas while backward in others. These symptoms would be a fair description of someone with a mild case of autism.
For many people biting their nails is a common repetitive behavior, but is it a symptom of ASD? It’s questions like that which cause autism to be such a difficult medical diagnosis to make. (Credit: Harvard Health)
It can get a lot worst. In some severe cases of ASD the patient can become completely non-verbal, simply refusing to speak while the repetitive behavior can include such things as head banging and other forms of self-harm. Even mild cases of autism can cause a patient to become violent whenever their routine is changed and the condition can greatly increase a person’s chances of depression and suicide. These are only a few of the behaviors associated with autism, anyone interested should consult other resources, of which there are many.
Anyone who causes harm to themselves is certainly in need of help, but is it always a sign of ASD? Again, a correct diagnosis can be difficult to determine. (Credit: The BMJ)
The problem with having a medical condition that has so many different symptoms, and those symptoms can appear to a large varying degree is trying to figure just who has the disorder and who hasn’t. If someone likes to be alone and is good at math, as I am, does that mean they are mildly autistic? Just as autism was ignored back in the 1960s it’s quite possible that today some people are being diagnosed as autistic who are actually pretty normal! In a sense the question is, where does personality end and autism begin?
Let’s be real, our differences on the outside are tiny compared to our differences on the inside, what we call our personality. So where is the line between having a different personality and having Autistic Spectrum Disorder? (Credit: Luck Walker Recruitment)
Another question, why does it seem that autism only effects the young? Is there something going on now that is making the number of autistic children grow? Well none of that is actually true. Again back in the 1960s there simply was no agreed definition of autism so no one was autistic, no one was diagnosed as having the disorder.
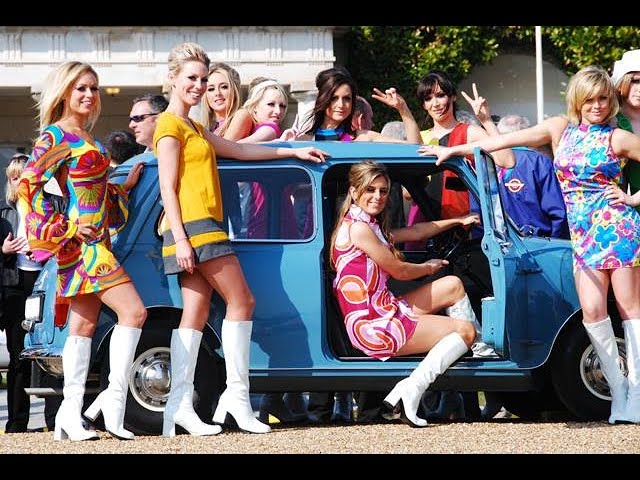
During the 1960s outlandish behavior was all the rage, but no one was diagnosed as having ASD. (Credit: YouTube)
There certainly were people back then who had problems interacting with other people, who showed repetitive behaviors. Without a clinical definition however, they simply weren’t being diagnosed as having a disorder. There’s little doubt that many adults, baby boomers like me could have been diagnosed as autistic, if doctors back then had been able to pay more attention to behavioral issues instead of infectious diseases. That’s primarily the reason for the growing number of autism cases, more and more pediatricians are simply looking for it.
It just makes sense that we’re much more likely to find something if we’re actually looking for it. That’s what’s happening with ASD, pediatricians nowadays are simply looking for it more often! (Credit: Shutterstock)
So what are the causes of autism? Well to be honest we still have a lot of work to do on finding the causes, one of the big reasons that autism is so hard to treat. The leading cause of autism is thought to be genetic but it is clear that there is no single ‘autism gene’. Rather it appears that autism develops from the interaction of a number of genes, that fits with the wide variety of symptoms. At the same time there is evidence that social factors can contribute, even trigger autistic behavior in someone who is genetically disposed to the disorder.
If you want to find the cause of most cases of ASD you need to look inside ourselves, at our DNA.
One thing is certain; autism is not caused by childhood vaccinations. The coincidence that autism in a child is usually first noticed at about the same age at which they are receiving their childhood vaccinations has resulted in untold harm both in the treatment of autism and the management of childhood diseases. Then there is the fraudulent paper by the British physician Andrew Wakefield that suggested that the Measles, Mumps and Rubella (MMR) vaccine was a cause of autism. This paper has not only been recanted by Wakefield’s co-authors but later, much larger studies involving 1.25 million children have conclusively shown that neither the MMR vaccine nor any childhood vaccination is a factor in the development of autism. Wakefield has in fact lost his medical license in the UK due to his fraud.
No longer legally allowed to practice medicine, Dr. Andrew Wakefield started a conspiracy against the MMR vaccine in order to promote his own vaccines. (Credit: MPR News)
Despite all of the evidence indicating that autism is not caused by any kind of vaccine or drug, conspiracy based allegations continue to spread on the Internet. Worst still these baseless assertions now have a champion in the Secretary of Health and Human Services Robert F. Kennedy Jr. Back in April RFK jr. announced that he and his department would be studying Autism and would declare the cause of the condition by September.
Seven months to find the “cause” of a disorder affecting millions of people? Sure Bob!!! (Credit: TikTok)
The very idea that anyone or any organization could discover the cause of any disease so quickly immediately showed that Kennedy had no intention of doing any actual science but rather the plan was to simply declare that one or more conspiracy theories was the cause of autism. True to Kennedy’s word on September 22nd Trump went on nationwide TV to tell the world that the Tylenol, chemical name acetaminophen, use by pregnant women is the main cause of autism, although we still vaccinate our children too much.
Hopefully I have convinced you my readers that Autism, ASD is a much more complicated problem that cannot be ‘cured’ by any kind of hysteric action. We need to study this behavior in a unemotional, scientific manner if we expect to ever find ways to prevent autism.
Pretty young actresses are a dime a dozen in Hollywood, have been for more than a century now. Anyone who dreams of making a career in acting goes to tinsel town in the hopes of being discovered and becoming a big movie star. In many ways Tilly Norwood is just another face in the crowd, she’s had a few screen tests and she’s started a video blog (vblog) where she talks about her life and the career she hopes to have. Just like a lot of other young actresses.
Actress Tilly Norwood enjoying her morning stroll while stopping for a coffee. Sounds just like a lot of people’s lives except that Tilly is just the invention of a computer program that has been taught, you don’t program an AI you teach it, to generate realistic images of a young woman who hopes to become an actress. (Credit: Wikipedia)
Tilly Norwood is not like other actresses however because she actually doesn’t exist except as several billion bytes of data stored on computer hard drives. You see Tilly Norwood is a creation of Artificial Intelligence (AI), a computer program that has been trained to reproduce how real actresses look and behave. Tilly is the invention of a Dutch actress with a Master’s Degree in Physics (There’s a combination for ya!) named Eline Van der Velden whose company Particle6 developed and currently holds all the rights to Tilly.
Actress and Physicist Eline Van der Velden is the creative force behind Tilly Norwood. Her company, Particle6, is hoping to get Tilly some real roles in movies and videos. They also plan to develop other AI generated performers as well. (Credit: Physics World)
So far Tilly has only appeared as an actress in brief sketches, both comedy and drama, and only by herself. Nevertheless her creator (her Dr. Frankenstein?) hopes that Tilly will become the next Scarlett Johansson and her company hopes to develop other ‘hyperreal digital stars’ for TV, movies as well as social media. At the same time Van der Velden insists that Tilly ‘is not a replacement for a human being but a creative work – a piece of art”, something of a contradiction on her part.
One way to distinguish between and AI generated image and an image of a real person is in the eyes. In the eyes of a real person the reflections of any lights have to be the same, that’s just physics. If the reflections are different, as in this case, then the image is computer generated. Of course, knowing this the people who use AI to generate such images are teaching their programs to make the reflections the same. All this turns into an arms race between the scientists trying to find techniques to separate real from fiction and the people trying to make their images seem as real as possible. Also just remember the old adage, if something looks too good to be real, it probably isn’t! (Credit: Instagram)
Very few real actors would agree with Van der Velden. In fact dozens of actors and actresses have criticized the whole project. The fact that Particle6 has recently announced that they are activity seeking an agent for Tilly has only made matters worse with the Screen Actors Guild (SAG-AFTRA) calling for a boycott of any agent who takes on an AI creation as a client.
Of course, real actors are no happier about computers taking their jobs than factory workers or cab drivers. The recent strike by Sag-Aftra was partly about the use of AI in Hollywood. (Credit: Rolling Stone)
In response Particle6 points out how in the past animation and CGI opened up new possibilities in entertainment and so they say will AI. The difference is of course that with animation and CGI it is still possible to distinguish the product from reality. As the AI creations continue to get better and better however it’s becoming more and more difficult to be certain just what is reality.
Did animation take jobs away from real actors? The people using AI to generate realistic actors feel that they are simply improving the technology of an art form that has been around for decades. (Credit: D23)
You can understand how real actors feel about the possibility of AI avatars taking their jobs. We are all aware of how automation has replaced millions of blue-collar factor workers and how driverless cars are currently threatening the future of truck drivers, cab drivers and bus drivers. With the latest computer programs that can learn, that’s what an AI is, a program that can be taught how to do a job rather than having to have each step in a process carefully written out for it, a huge number of white-collar jobs are now in jeopardy. One of the big issues that caused the recent strikes by SAG-AFTRA and the Screenwriters Guild was the use of AI by Hollywood Producers.
Over the last 60 years automation has eliminated millions of blue-collar jobs. Is this now going to happen to white-collar jobs as well? (Credit: Asia Sentinel)
The fear of AI in Hollywood includes not only actors but also screenwriters, set designers, cameramen and even directors. Think about it, producers would no longer have to put up with temperamental actors, or actors who are getting a little too old for the part, or who have gained, or lost weight. TV audiences in particular like to see a familiar face each week so why not give them an AI whose face never changes no matter how long their show has been on. Right now there’s the difficulty of how to get an AI actor to be on the screen at the same time as a real actor but that’s a technical problem and will be solved in a few years.
The Geico Gecko, who is just CGI, already interacts with people in a limited fashion. In the same way AI actors will probably get their first ‘roles’ in commercials rather than TV shows or movies. (Credit: The New York Times)
There’s one more thing that gets actors very upset about AI actors. I mentioned above that the Particle6 AI learned how actors and actresses look and behave. Well how did it do that? By looking at hours and hours of real actors and actresses that’s how. Many in the entertainment field feel that AIs like Tilly are using their performances, stealing their rights and there are certainly going to be lawsuits dealing with the question of just how much of Scarlett Johnasson, or other actresses is there in Tilly and other AIs like her.
This is a screen shot from a YouTube site, I’m not including the name of the site. The site is just dozens of short AI videos of ‘girls’ none of whom actually exist. Now these ‘girls’ are not as sophisticated as Tilly Norwood, all they do in the videos is shake their booty, but they all have biographies and wikis! This is getting a little crazy don’t you think! (Credit: R. A. Lawler)
I’m betting that AI will worm its way into Hollywood through advertisements. Think about it, we already have plenty of ads with non-real characters in them like the Geico Gecko or the Liberty Mutual Emu. Producers of local commercials may not be restricted by the same contract rules as Hollywood producers and will undoubtedly be tempted to go fully AI once the technology has proven itself.
Another way of distinguishing an AI generated image is to look carefully at the background. The people who create these images don’t pay as much attention to the background so you can often spot weird things there. What does ‘Refima’ , see inset, mean? (Credit: R. A. Lawler)
Then there’s also the question of how society will react to AI creations on our movie, TV and mobile screens. Will the perfect AI faces we can see at any time cause us to retreat further from real interactions with real humans? Hollywood has already given us celebrities whose attractiveness and exciting lives make us pay less attention to the people around us. What will happen when we have AI generated characters who are designed to be perfect!
Is this our future? I hope not! (Credit: Facebook)
It all just goes to show how computers are taking over the jobs that millions of human beings have relied on for generations. We have to start figuring out what kind of world are we going to have when AI has been fully integrated into society. Whether that integration will be for the good of humanity or not, is still very much in question.
The Nobel prizes for 2025 in the categories of Physiology or Medicine, Physics and Chemistry have been announced and this year there’s a common theme running through the science prizes.
Funded in the will of Alfred Nobel, the Nobel Prizes were first awarded in 1901. (Credit: Science News Explores)
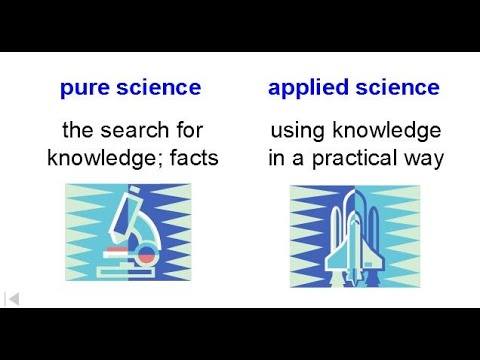
We’re all familiar with the difference between practical research, that is research that immediately yields benefits to people or that, more importantly, immediately makes money and more fundamental research, the kind of studies that are made simply for the joy of knowing and which are unlikely to ever make any money. Good examples of the practical science would be studying insecticides to help eliminate pests like locusts while pure research would be studying how locusts manage to come together in such huge numbers that they form a destructive swarm. You may have noticed in my example that the pure research may in fact discover facts about locusts that could be applied to reduce the harm they do without resorting to poisons that harm other creatures as well as locusts.
Think about it, without the facts discovered by pure science there’s nothing for the practical scientist or engineer to apply! (Credit: YouTube)
A lot of people take a dim view of fundamental research. After all science is about making all of our lives better isn’t it. Science just for the pure joy of knowing only benefits a few nerds while the rest of us never understand it anyway. Pure science isn’t worth the money it costs they feel. Of course the irony is that without the pure research there wouldn’t be any new ideas, any new discoveries for the ‘practical men of science’ to work with. Well, this year’s Nobel prizes in the sciences celebrate several examples of pure research that in the decades since they were carried out have yielded a great deal of practical benefits.
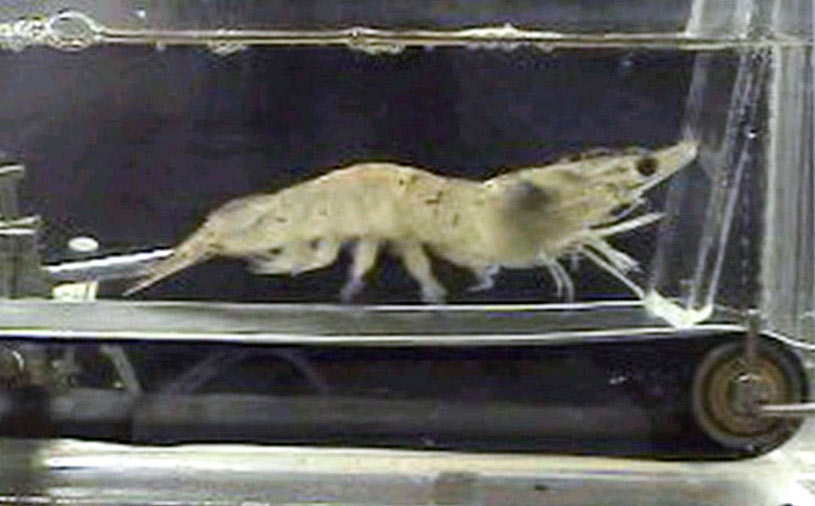
The ignorant people at Fox News like to joke about 3 million dollars in federal money being wasted on leaning how fast a shrimp can run on a treadmill. Actually, the study was an examination of the entire lifecycle of shrimp which has proven to be immensely valuable to the shrimp industry! The treadmill part of the study cost all of fifty bucks! (Credit: Science)
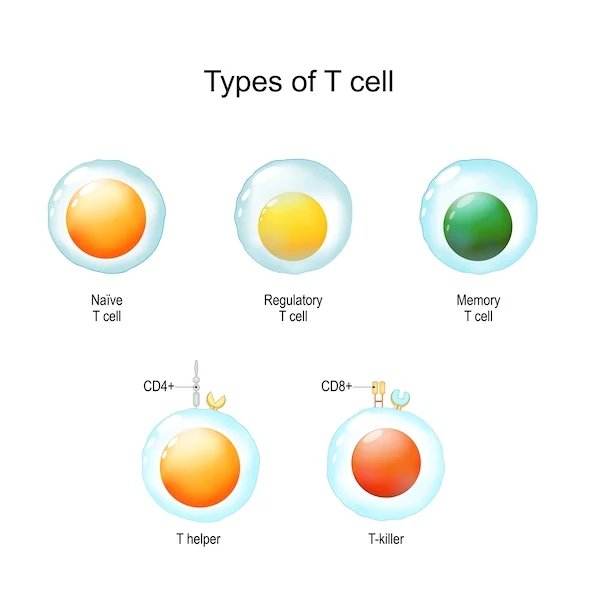
The first up this year was the Nobel prize for Physiology or Medicine which was awarded on the 6th of October to Mary E. Brunlow of the Institute for Systems Biology in Seattle, Washington, Fred Ramsdell of Sonoma Biotherapeutics in San Francisco, California and Shimon Sakaguchi of Osaka University in Osaka, Japan for their research on how the Immune System works. Specifically the trio examined the phenomenon of ‘peripheral immune tolerance’, that is how the disease fighting T-cells in the immune system of our bodies know to attack foreign cells like bacteria but not to attack our own cells.
This year’s Nobel Prize in Physiology or Medicine went to Mary E. Brunkow, Fred Ramsdell and Shimon Sakaguchi. (Credit: UCLA Newsroom)
It was Dr. Sakaguchi who began the research in 1995. Working with labouratory mice Sakaguchi discovered a previously unknown type of T-cell that regulated the behavior of the more common, disease fighting T-cells that he named ‘regulatory T-cells’. Then in 2001 Doctors Brunkow and Ramsdell discovered a series of gene mutations that could result in dysfunction of the body’s T-cells resulting in autoimmune diseases like eczema or arthritis. Later Sakaguchi was able to demonstrate that the two studies were linked through his regulatory T-cells.
The T-Cells in our body are a major part of our ability to fight diseases. This year’s Nebel Prize in Medicine was awarded for the discovery of, and study of the regulatory type of T-cell. (Credit: Beckman Coulter)
Since that time the research carried out by Sakaguchi, Brunkow and Ramsdell has led to new treatments for autoimmune diseases along with techniques to prevent the rejection of transplanted organs. There are currently over 200 clinical trials underway that are based on the science gained by the trio’s ‘fundamental study’.
As our population ages autoimmune diseases are becoming more and more of a concern. These afflictions occur when our disease fighting T-cells attack the cells of our body. (Credit: NIH Medline Plus Magazine)
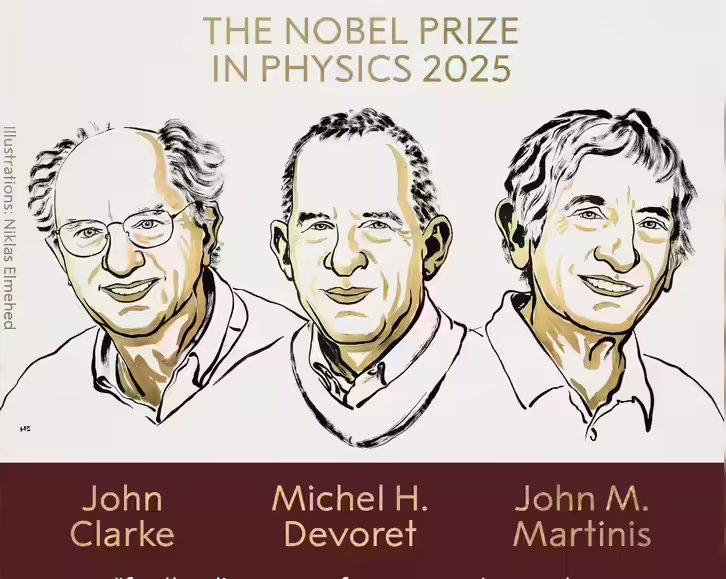
On the 7th of October it was Physics turn and this year’s Nobel was awarded to John Clarke of the University of California in Berkeley, Michel H. Devoret of Yale University and John M. Martinis the University of California at Santa Barbara for their work on quantum mechanics and in particular for research that laid the foundation for quantum computers. In research carried out in the 1980s the three scientists examined the way that energy was quantized in an electric circuit. In their work they discovered the ability of electrons to ‘tunnel’ their way through energy barriers that classically they would not be able to cross.
This year’s Physics Nobel went to John Clarke, Michel H. Devoret, and John M. Martinis. (Credit: Times of India)
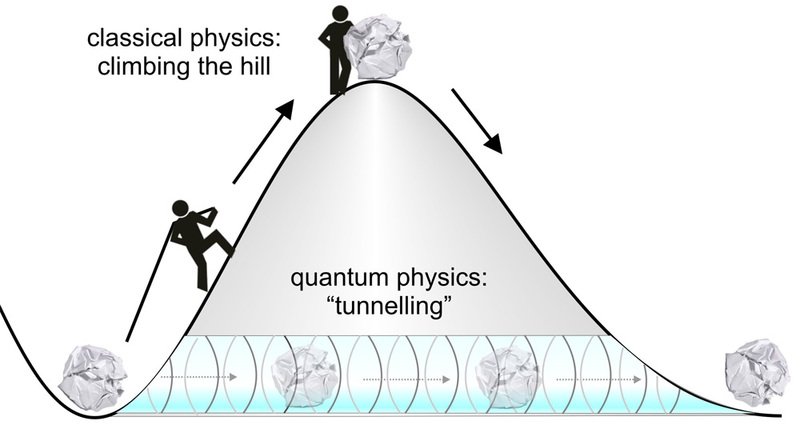
This phenomenon is now a key to many of the microchips that today’s technology relies upon. Everything from digital cameras to mobile phones are dependent on quantum tunneling. What’s more the development of new, more powerful quantum computers is a direct result of the work by doctors Clarke, Devoret and Martinis. Once again fundamental research, studying how energy is quantized in an electric circuit, has resulted in technology worth literally billions of dollars.
In classical physics in order to get over a hill it’s necessary to have enough energy to get to the top of the hill. In quantum physics even if you don’t have enough energy you can tunnel through thanks to the uncertainty principle. Mind you, tunneling may take billions of years! (Credit: Max-Planck-Gesellschaft)
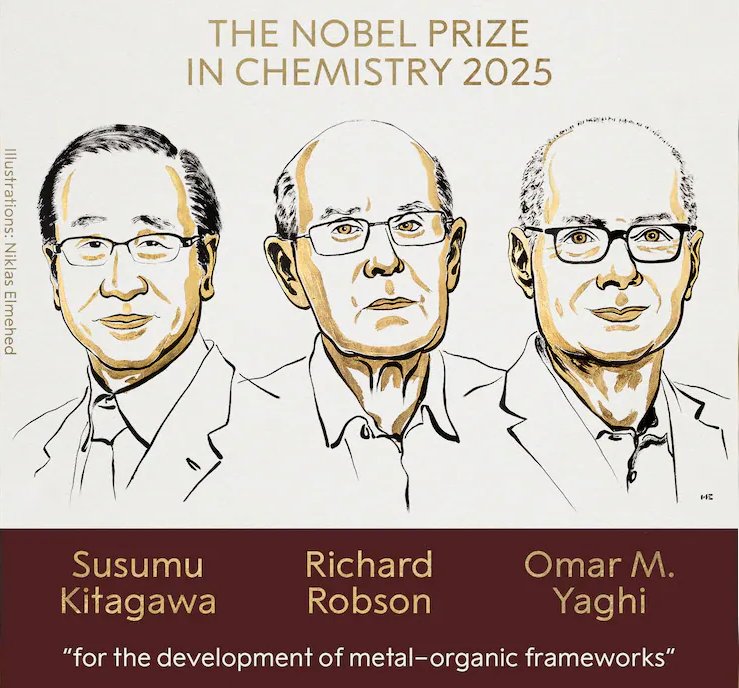
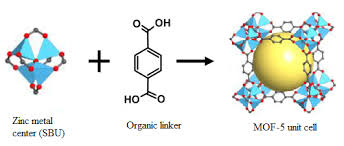
On the 8th of October the final Nobel science prize was awarded for Chemistry to Susumu Kitagawa of Kyoto University in Japan, Richard Robson of the University of Melbourne and Omar Yaghi at the University of California in Berkeley for their work on Metal-Organic Frameworks (MOFs). These are materials that are capable of soaking up large amounts of either gasses or liquids like a sponge and then releasing them so that they can be captured.
This year’s Chemistry Prize went to Susumu Kitagawa, Richard Robson and Omar M. Yaghi. (Credit: NDTV)
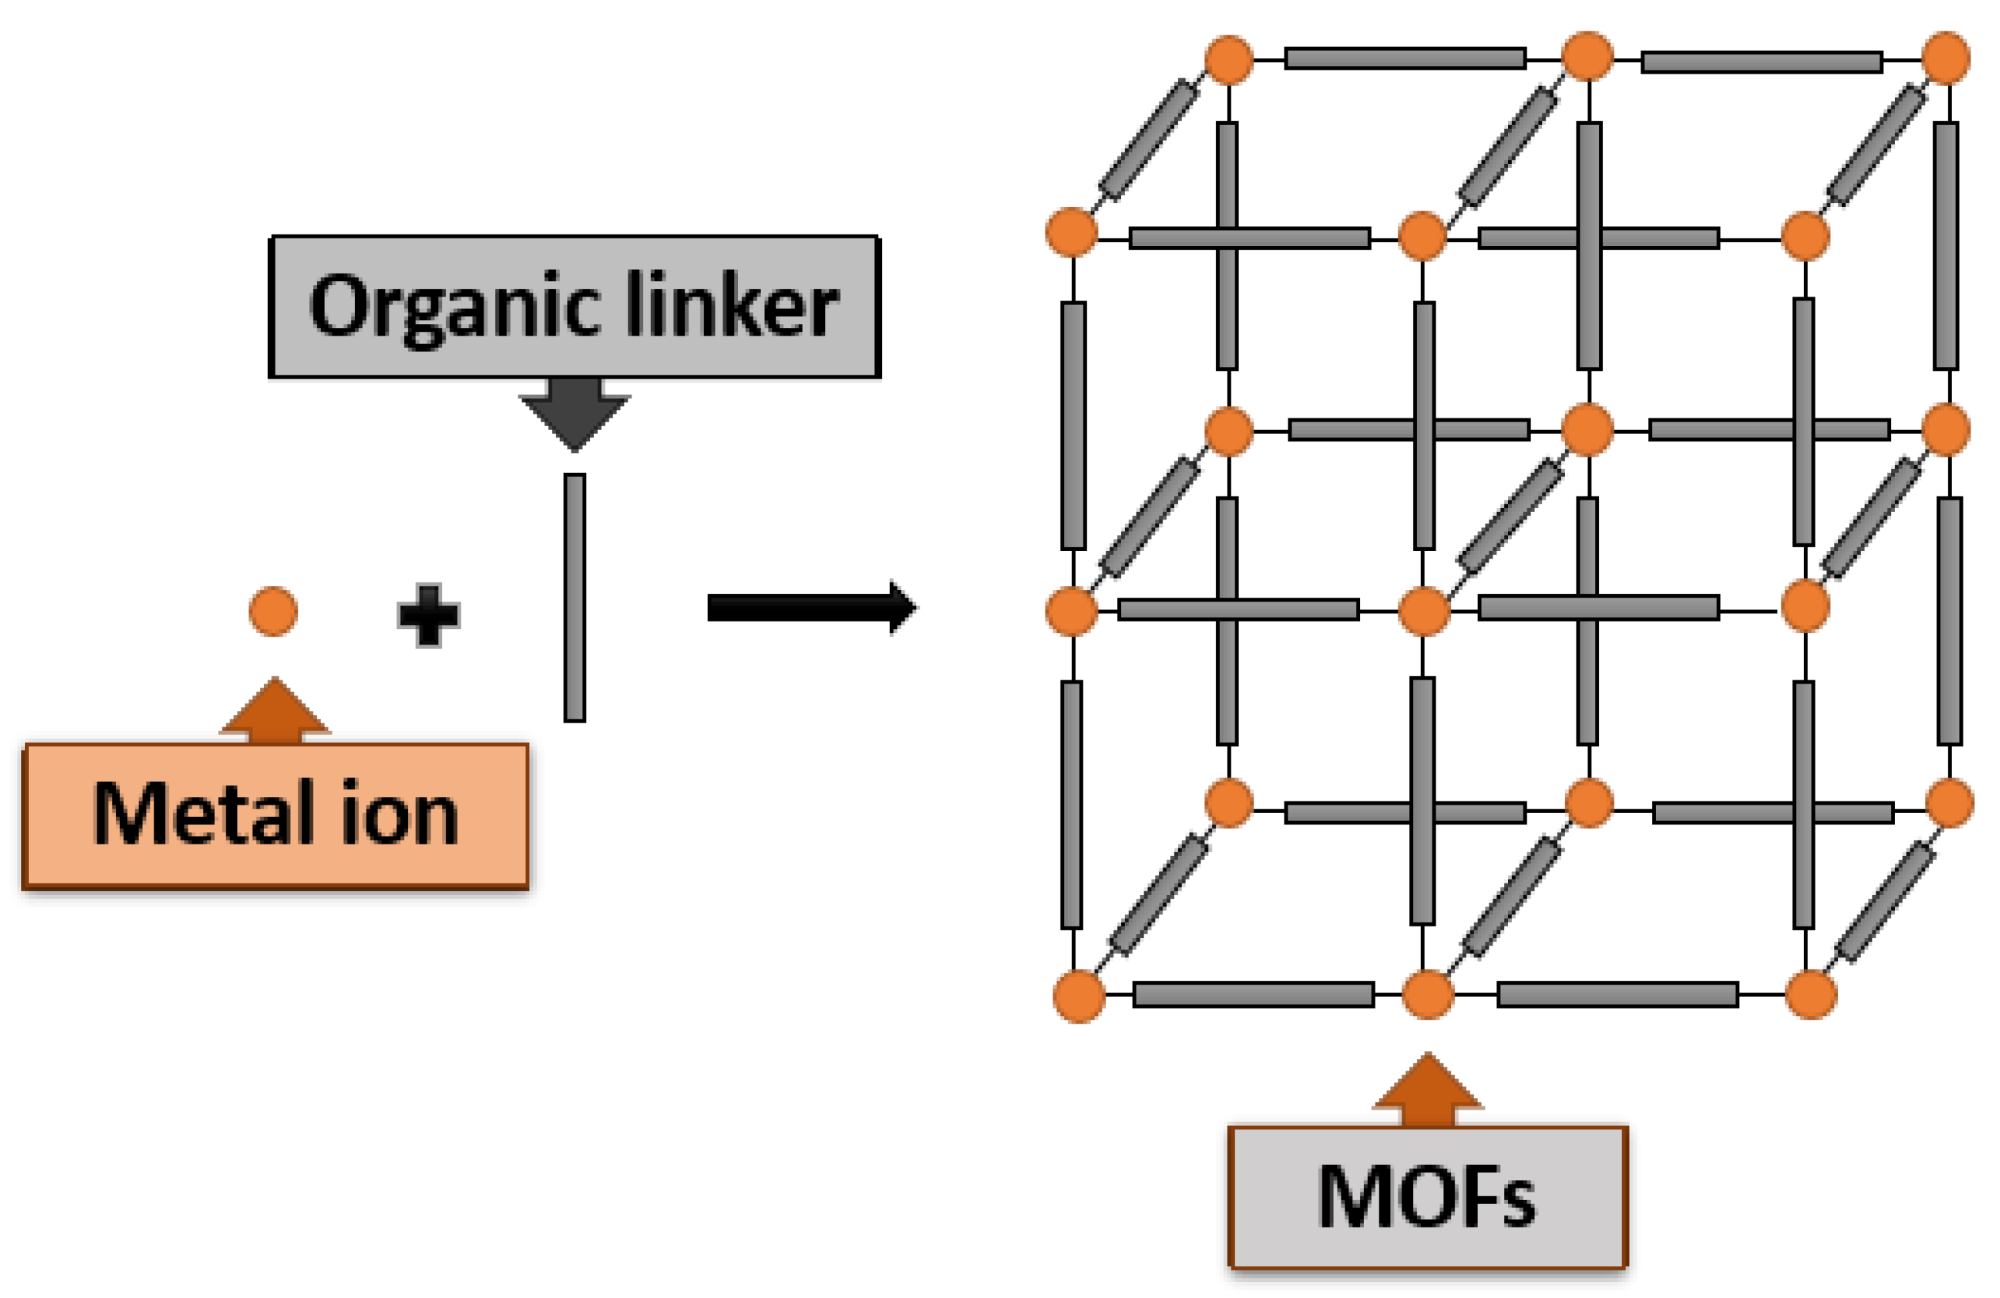
You see most chemical reactions take place at surfaces. Think about it, when you put a wooden log on a fire the combustion takes place at the intersection of the wood and the oxygen in the atmosphere, at the log’s surface in other words. MOFs are materials that contain myriad pores and channels throughout them giving them an enormous amount of surface area where chemical reactions can take place.
Metal-Organic Frameworks (MOFs) have large volumes but contain a lot of empty space inside them. This allows the MOFs to absorb a lot of gasses or fluids. (Credit: MDPI)
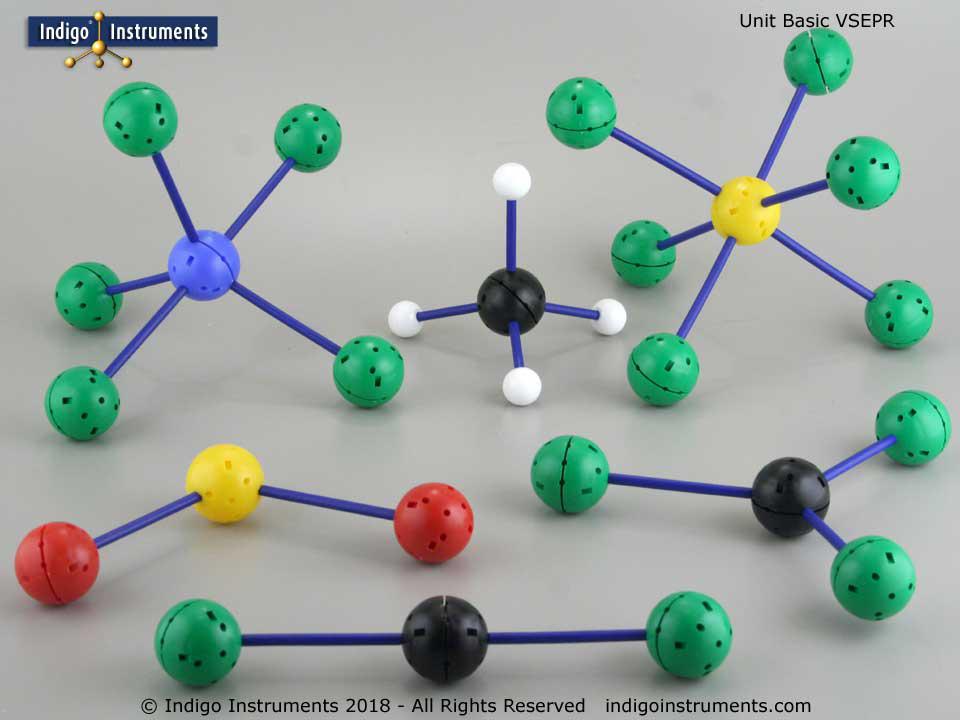
The discovery of MOFs began way back in the 1970s when Dr. Robson was using wooden balls as models of atoms for his class. In order to construct molecules out of his wooden atoms he drilled holes in them so that he could then use rods to connect them together. As he was drilling the holes he realized that a lot of chemical information was contained in where and how many holes he drilled. In a series of experiments Robson was able to produce copper compounds that contained large cavities creating a large amount of surface area per unit volume.
Remember your High School chemistry class when your teacher showed you have molecules were built using balls connected by rods. Well, that’s what Dr. Robson was doing when he had the idea for MOFs. (Credit: Indigo Instruments)
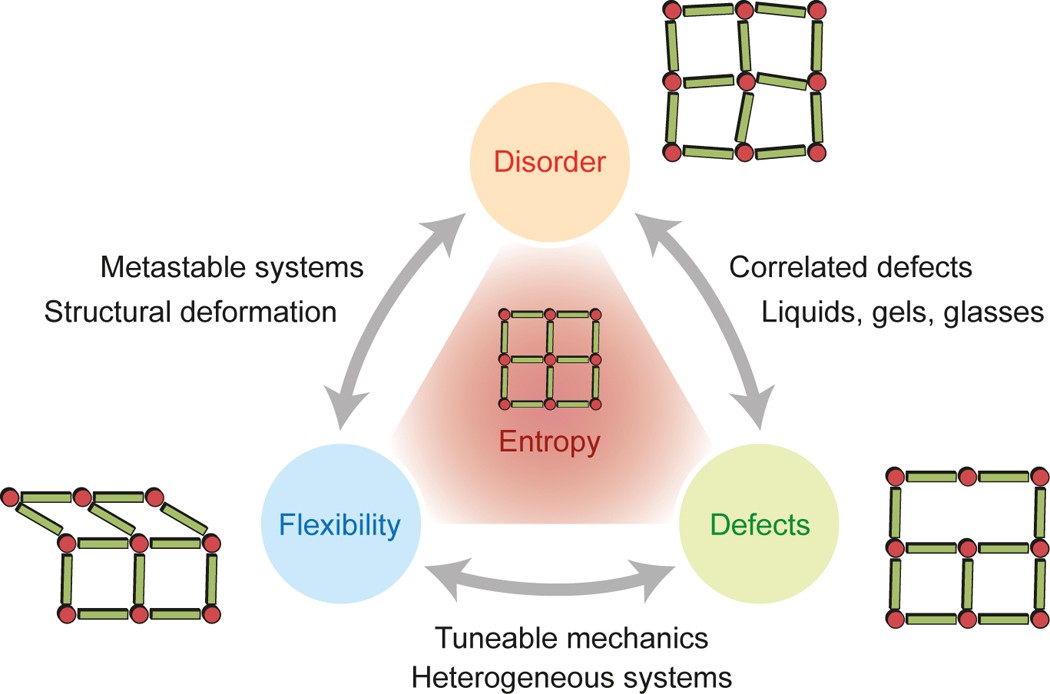
Doctor Kitagawa extended Robson’s ideas eventually developing materials that could absorb and then release large amounts of methane or nitrogen or even oxygen. One problem with these first MOFs was that they were rather delicate; heating in particular caused their inner surfaces to collapse.
A lot of MOFs are subject to defects and are very fragile substances. (Credit: Nature)
It was Doctor Yaghi who solved this problem with MOF-5, which can be heated to 300º Celsius without degradation. Yaghi has since experimented with his MOF to capture water vapour in the desert of Arizona during the night and then releasing it during the day.
The component parts of MOF-5, shown on the right having captured a gas or liquid molecule. (Credit: Journal of Chemical Reviews)
Again it can be seen how fundamental research back in the 1970s has developed into practical engineering with several companies working on producing MOFs in large quantities to absorb CO2 from the atmosphere, reducing the amounts of greenhouse gasses. All of the scientific studies that were awarded the Nobel prize this year share that idea in common, fundamental research that leads in time to practical innovation.
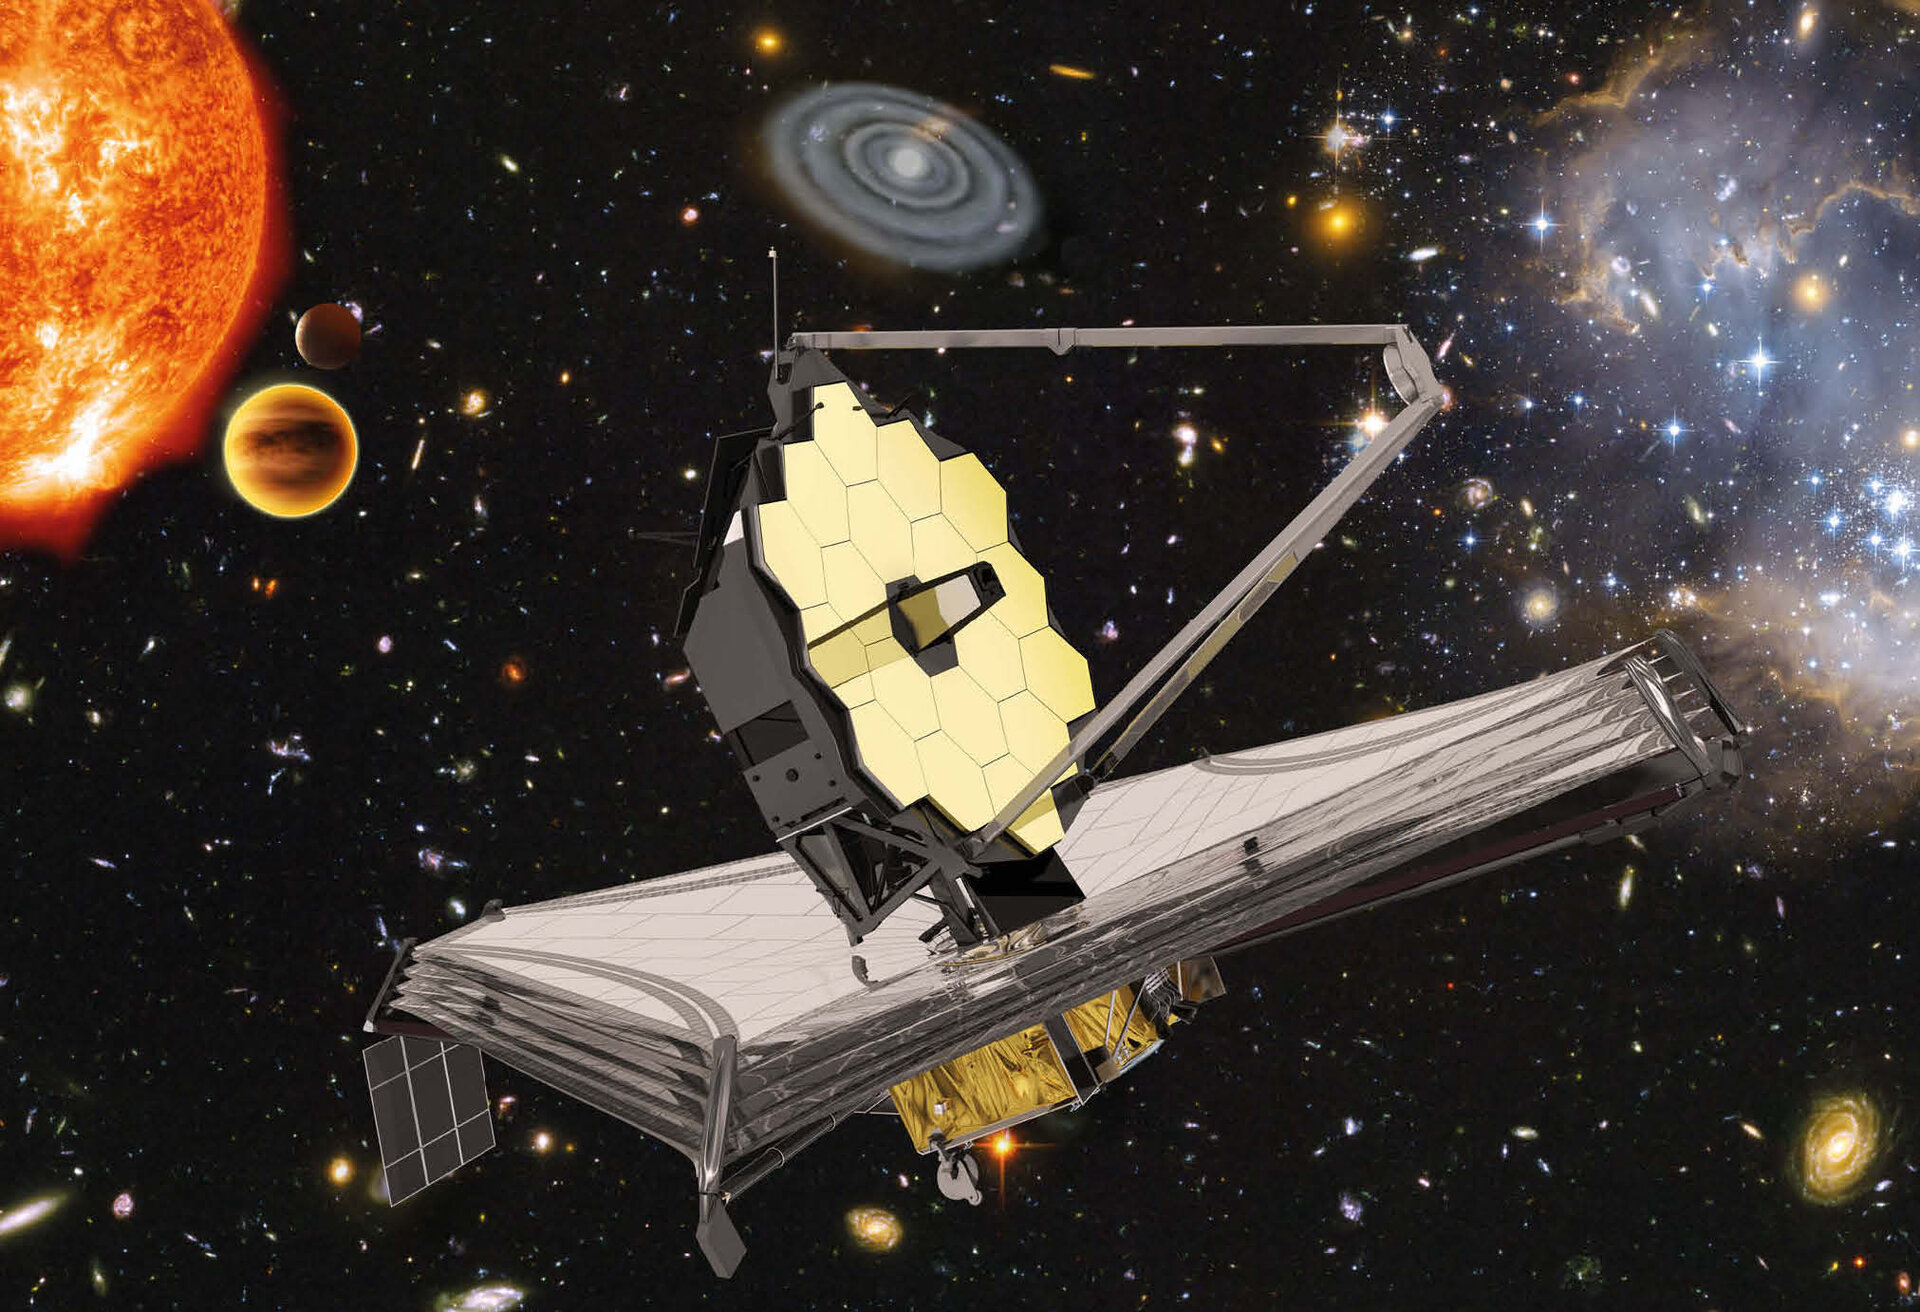
As I described in several earlier posts, see 6July2024 and 22Febuary2025, one of the prime design goals of NASA’s new James Webb space telescope was to be able to study the early Universe, that is the Universe as it appeared just about one billion years or less after the Big Bang. How does that work, you ask? How can any telescope, even one as advanced as James Webb, see into the past?
By looking at objects billions of light years from Earth the James Webb Space Telescope actually looks billions of years into the past, seeing our Universe as is was billions of years ago. (Credit: European Space Agency)
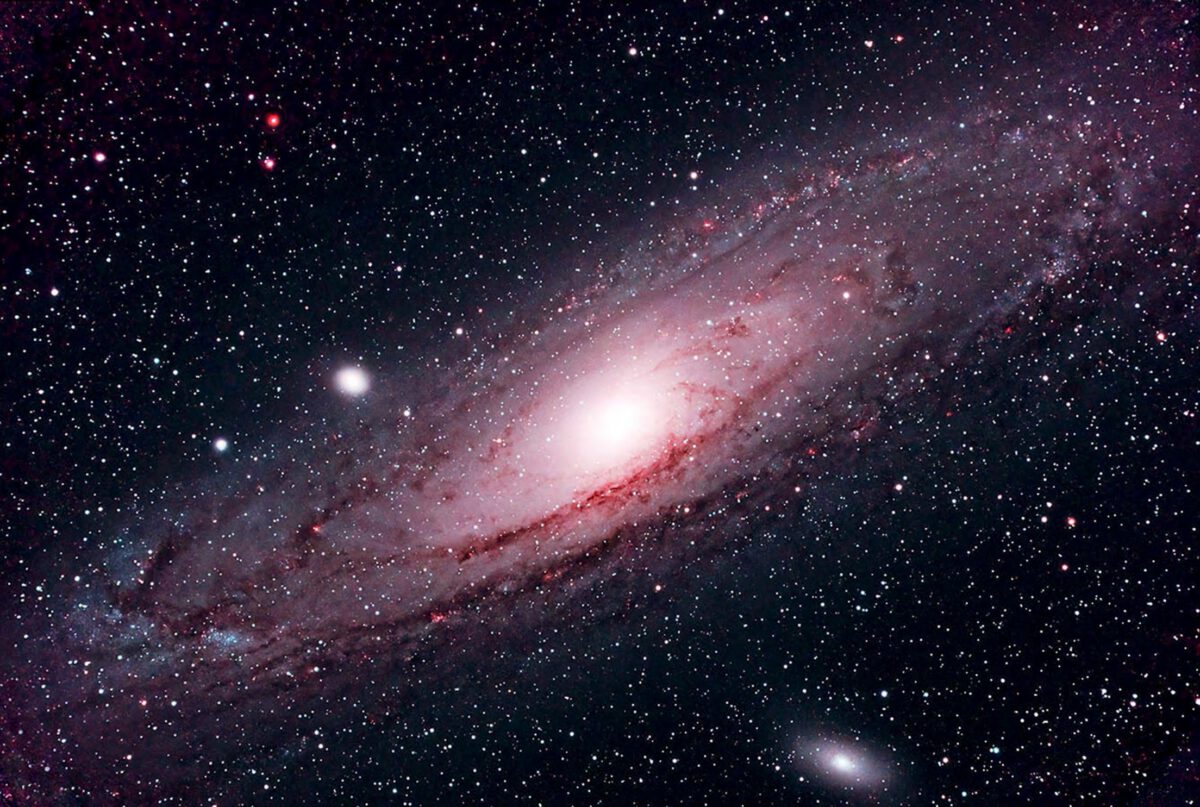
Well actually all telescopes look into the past. Because the speed of light is finite, about three hundred million meters per second, if you look at the star Sirius for example, at a distance of 8.7 light years you are not seeing Sirius as it is but rather as it was 8.7 years ago because that’s when the light entering your telescope left Sirius. Similarly, if you look at the North Star Polaris, at a distance of about 500 light years you are seeing Polaris as it was 500 years ago. The distance to the Andromeda galaxy is about two and a half million light years so whenever an astronomer looks at Andromeda they are looking two and a half million years into the past.
The famous Andromeda Galaxy is the farthest object you can see with your naked eye, although it doesn’t look this good. At a distance of two and a half million light years it takes the light from Andromeda two and a half million years to reach your eyes. So, when you look at Andromeda you’re looking two and a half million years into the past. (Credit: Astronomy Magazine)
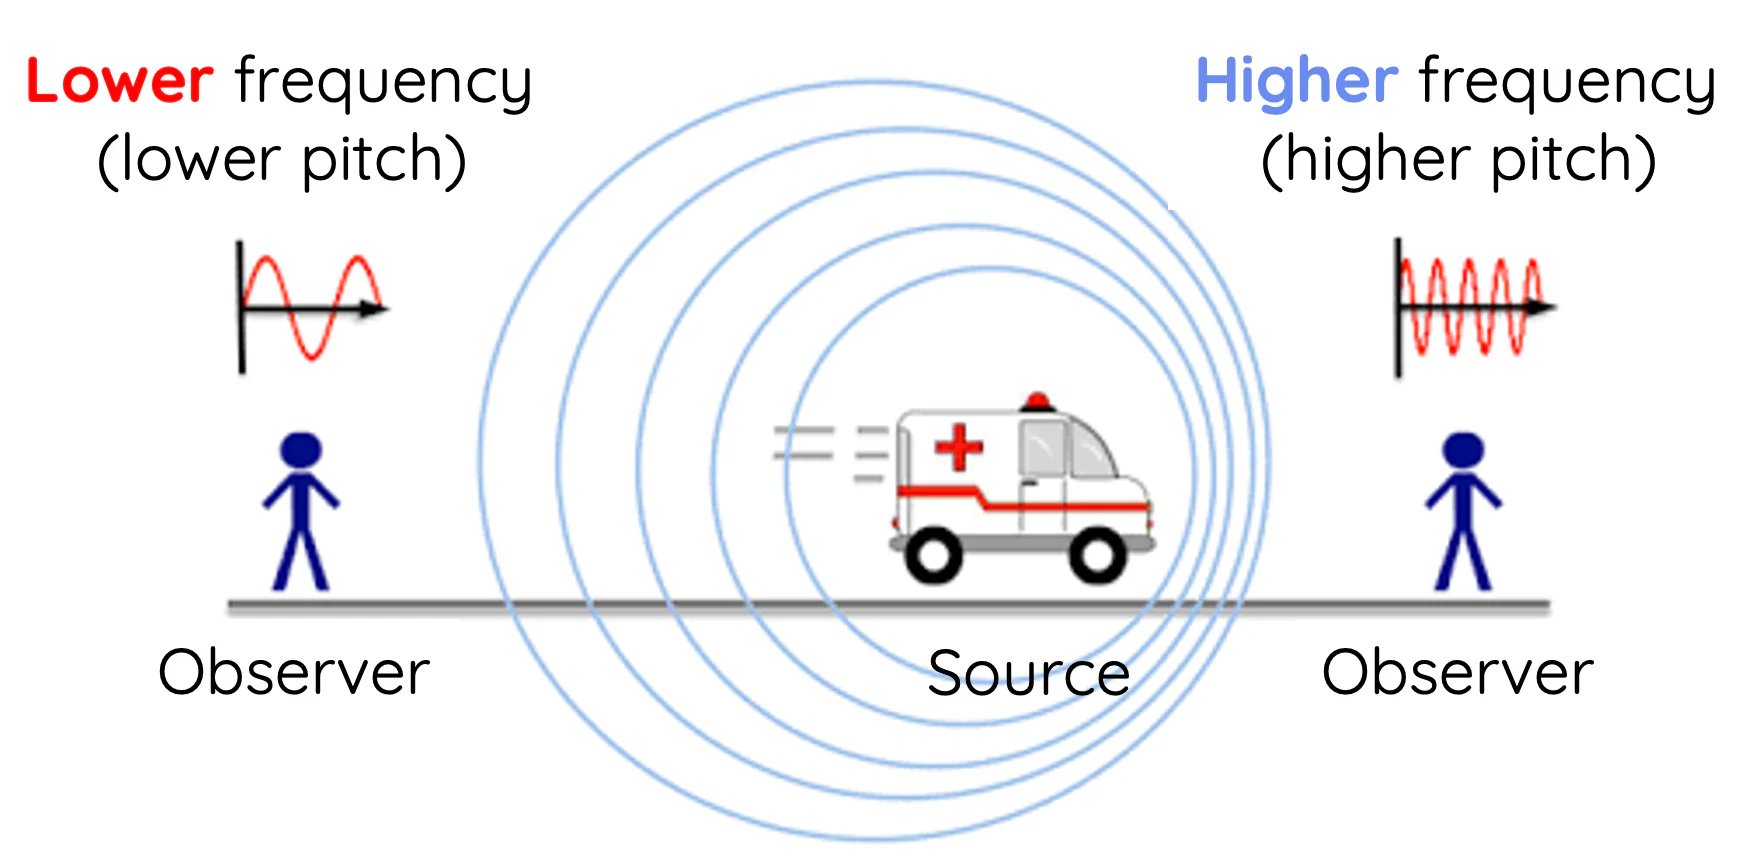
Most galaxies are in fact billions of light years away so astronomers observe them in order to try to understand how the Universe has changed, how the galaxies evolve over billions of years. There’s a catch however, because the entire Universe is expanding, the further away a galaxy is the faster it is moving away from us, and objects that are moving that fast away from us have the light they emit shifted into the infrared due to the Doppler effect.
We’re all actually familiar with the Doppler effect. Whenever an emergency vehicle is moving towards you its siren has a higher pitch than when it is moving away from you. The same thing happens to light so that’s how we know that the Universe is expanding, the light from all but the very closest galaxies is shifted towards the red. (Credit: Science Ready)
Which is why the design of the James Webb space telescope was centered around its ability to see in the far infrared. That’s also why the telescope had to be positioned more then a million kilometers from Earth because our planet also emits a lot of infrared light, enough to blind Webb’s sensitive instruments. Astronomers can also use James Webb to study other objects closer to home like the gas clouds where stars are born but first and foremost the space telescope was intended to study the Universe at around one billion years after the Big Bang.
The famous Pleiades star cluster is a huge gas cloud in our galaxy that has been a stellar nursery forming hundreds of stars over the last couple of million years. By seeing in the infrared Webb can actually see through the gas and dust to actually see stars being born. (Credit: Space)
So what did astronomers and cosmologists, physicists who study the Universe as a whole, expect James Webb to find. They had quite a few theories, basically the idea was that about half a million years after the Big Bang the Universe had cooled enough for atoms, mostly hydrogen and helium, to form and when that happened the whole Universe would grow dark because there were no stars yet to emit any light. The theorists expected that gravity would cause the first stars to form around a half billion years after the Big Bang and based on their calculations those first stars would be really big ones, very bright, very blue in colour. A few hundred million years later those first stars would then be clumping together to form the first galaxies.
Astrophysicists expected that the very first stars to form after the Big Bang would big really big and hot, glowing in the blue portion of the spectrum. (Credit: Forbes)
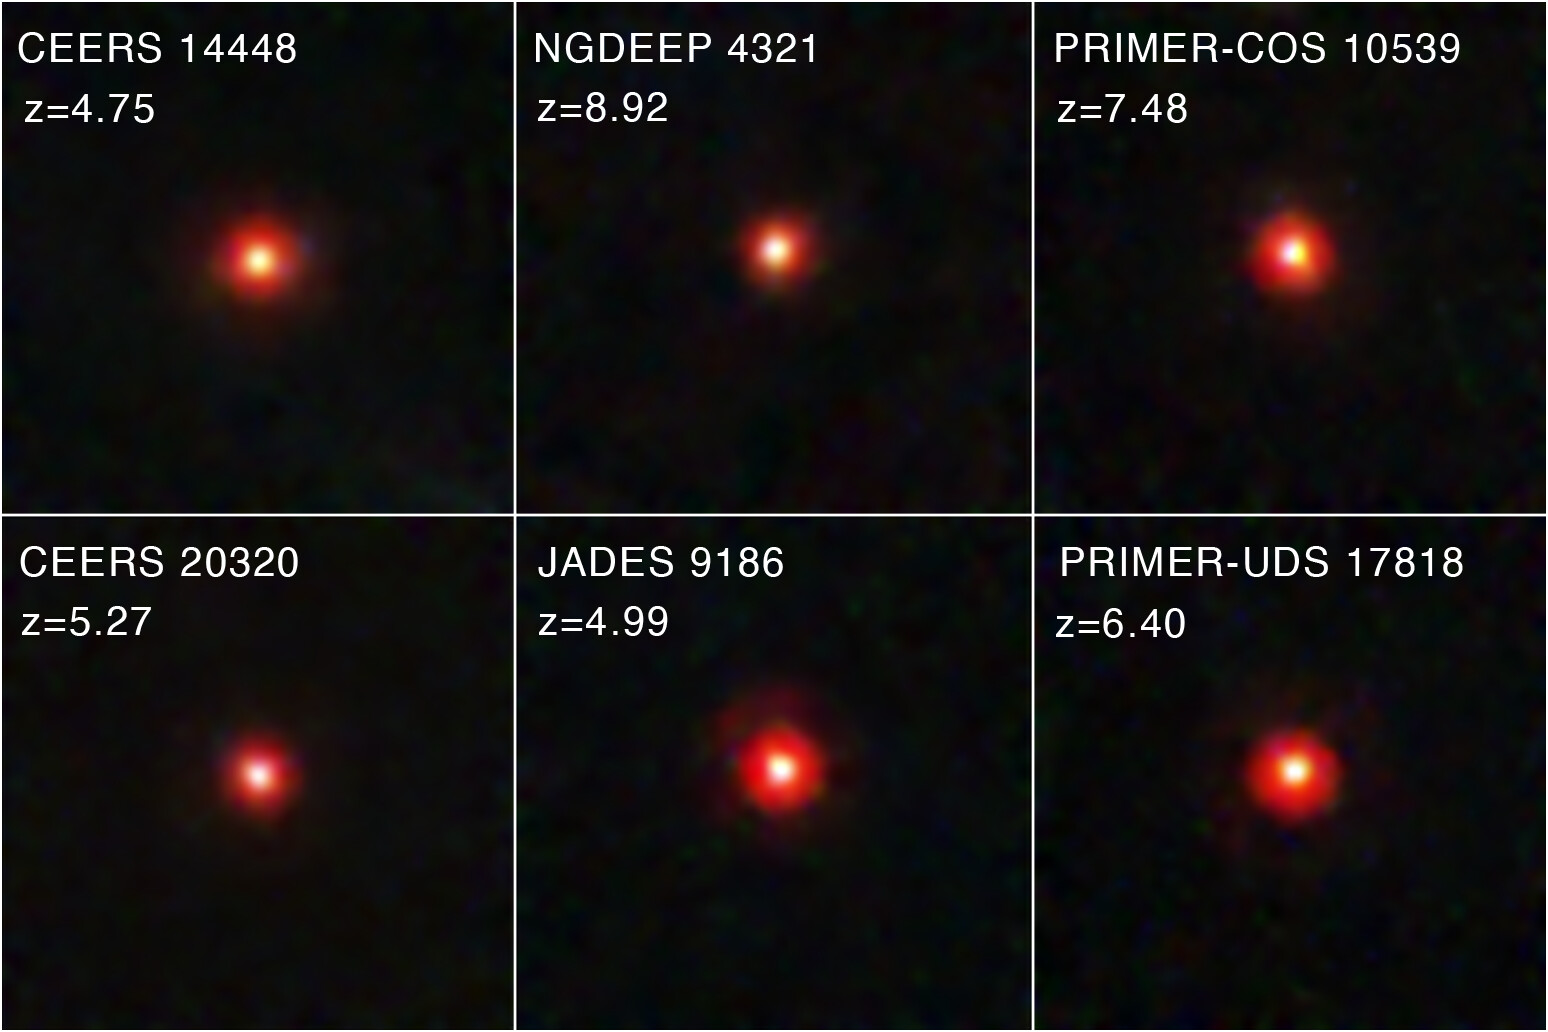
That’s pretty much what astronomers expected James Webb to see, small, simple galaxies containing a few million or so really bright stars. Instead what they got as they studied the first images from James Webb almost three years ago now were a bunch of ‘Little Red Dots’ (LRDs).
Instead, what James Webb found was a large number of ‘Little Red Dots’. (Credit: ESA/Webb)
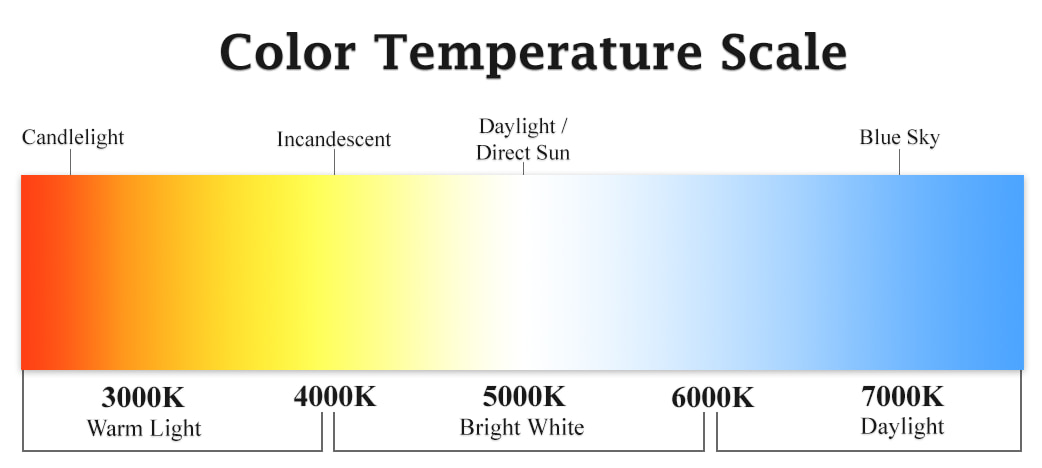
Colour means a lot to an astronomer, red stars are actually cool while blue or violet stars are much hotter so the LRDs that Webb imaged were not the big bright stars that astronomers were expecting. At the same time the objects seemed to be too small to be any kind of galaxies. For these reasons, among others the LRDs were initially called ‘Universe Breakers’ because they went against all of our theories about the early universe at that time.
We think of red as being the colour of fire but actually the colour blue is much hotter. (Credit: Commercial LED Lights)
Trying to come up with some kind of model to describe the LRDs astrophysicists first suggested that they were small but well formed galaxies with millions of red stars packed in real tight. The idea of such compact, well organized objects already existing just a few hundred million years after the Big Bang was so outrageous is the reason why astronomers considered them to be Universe Breakers. One thing everybody agreed on was the need for more data; especially we needed the spectrum of a few of these LRDs. The early Universe cosmologists had to wait their turn however, as other programs got their first chance with Webb.
Having to wait your turn, whether at a doctor’s office or elsewhere can be the most boring thing imaginal. (Credit: Medium)
Eventually Webb did return to observing the early Universe and succeeded in obtaining the spectra of some of the LRDs and that better data has caused a shift in thinking about what they could be. The latest model for the LRDs is a black hole that has succeeded in pulling so much material around itself that it looks much like a very large but very cool star.
The latest theory as to what the little red dots could be is that they are a black hole that has gathered a large amount of gas around it. Deep in the center the black hole is feeding, releasing large amounts of energy that causes the entire gas cloud to glow. (Credit: Space)
In a paper from the journal Astronomy and Astrophysics with lead author Anna De Graaff these objects have been named ‘Black Hole Stars’ because even though they get their energy from matter falling into a black hole at their center, their atmospheres closely resemble those of red dwarf stars. The researchers also suggest that the LRDs are in fact the early stages in the development of the Supermassive Black Holes that are now considered to be at the center of every big galaxy.
The first ever image of the supermassive black hole that is at the center of our Milky Way galaxy. The image was actually taken in radio waves and converted to a visible image. (Credit: CNN)
If that analysis is true, and there’s still a great deal to be learned about the LRDs, then James Webb has given us the answer to a question that has been bouncing around for the last twenty years or so. Which came first, do galaxies form supermassive black holes in their centers or do supermassive black holes form galaxies around them. If LRDs are baby supermassive black holes then before long Webb should find some of them with proto-galaxies around them.
We still know very little about how the galaxies formed. Hopefully James Webb will give us the data we need to understand how the Universe as it is today developed. (Credit: Wikipedia)
When, and if that happens the astrophysicists will have the data they need to rewrite their theories of how galaxies form. Then we will know more about how our Universe came to look the way it does.